
A week and a half ago I did my first race in five years, at the 1/8th electric buggy nationals in Vaasa. It gave me a great opportunity to test the TestLogger tools in real-world conditions.
This article showcases, through a couple of examples, what you can discover from the measured data, so the article focuses more on Collector and Analyzer rather than Manager. Collector handles the data collection, Analyzer is our data analytics tool for the measured data and Manager handles all the metadata like lap times, setups, conditions, comments, etc.
Be aware that the article will use some statistical elements and technical terms from full scale motorsports. I won’t define each item, but happy answer and discuss the terminology on our Discord server.
Preparation is the key
I had plans to do proper preparation for the race, but that didn't happen for various reasons and I paid the price for it. As everything wasn't properly set up, I ended up adjusting the setups, conditions, tires after the race. This impacted data analytics as well and all analytics have been done as post-race activity.
TestLogger Manager is designed so that you spend anywhere from a few minutes to a few hours before the race to prepare everything you can and during the race you manage the changes. A one-hour gap between heats makes it challenging to keep up with everything and it is very difficult to catch up if you are not prepared. Especially in my case because my previous race had been five years earlier, the routines are not in place.
Key takeaway: Prepare starting setup, Analyzer workspace, create tire sets, create first run with correct values on previous day(s). Prepare and validate that you are ready!
On race day focus on comments and if you don't mark setups, then make sure you add the setup changes to comments.
Measurement conditions
The race had two practice rounds, three qualifying rounds and three finals. Track was wet and slippery in the first round of practice but from practice round 2 onwards the conditions were pretty consistent. Track was drying throughout the day a bit and it was getting a bit slower. The track surface held up very well and it was very consistent all day. All metadata is collected to Manager and the measured data is included in the run in Manager.
This is how my Manager session change matrix looks after the race. The session matrix summarizes the day to one table. In the table you can also see the observations that Coach TQ made in the background based on run comments and other metadata.
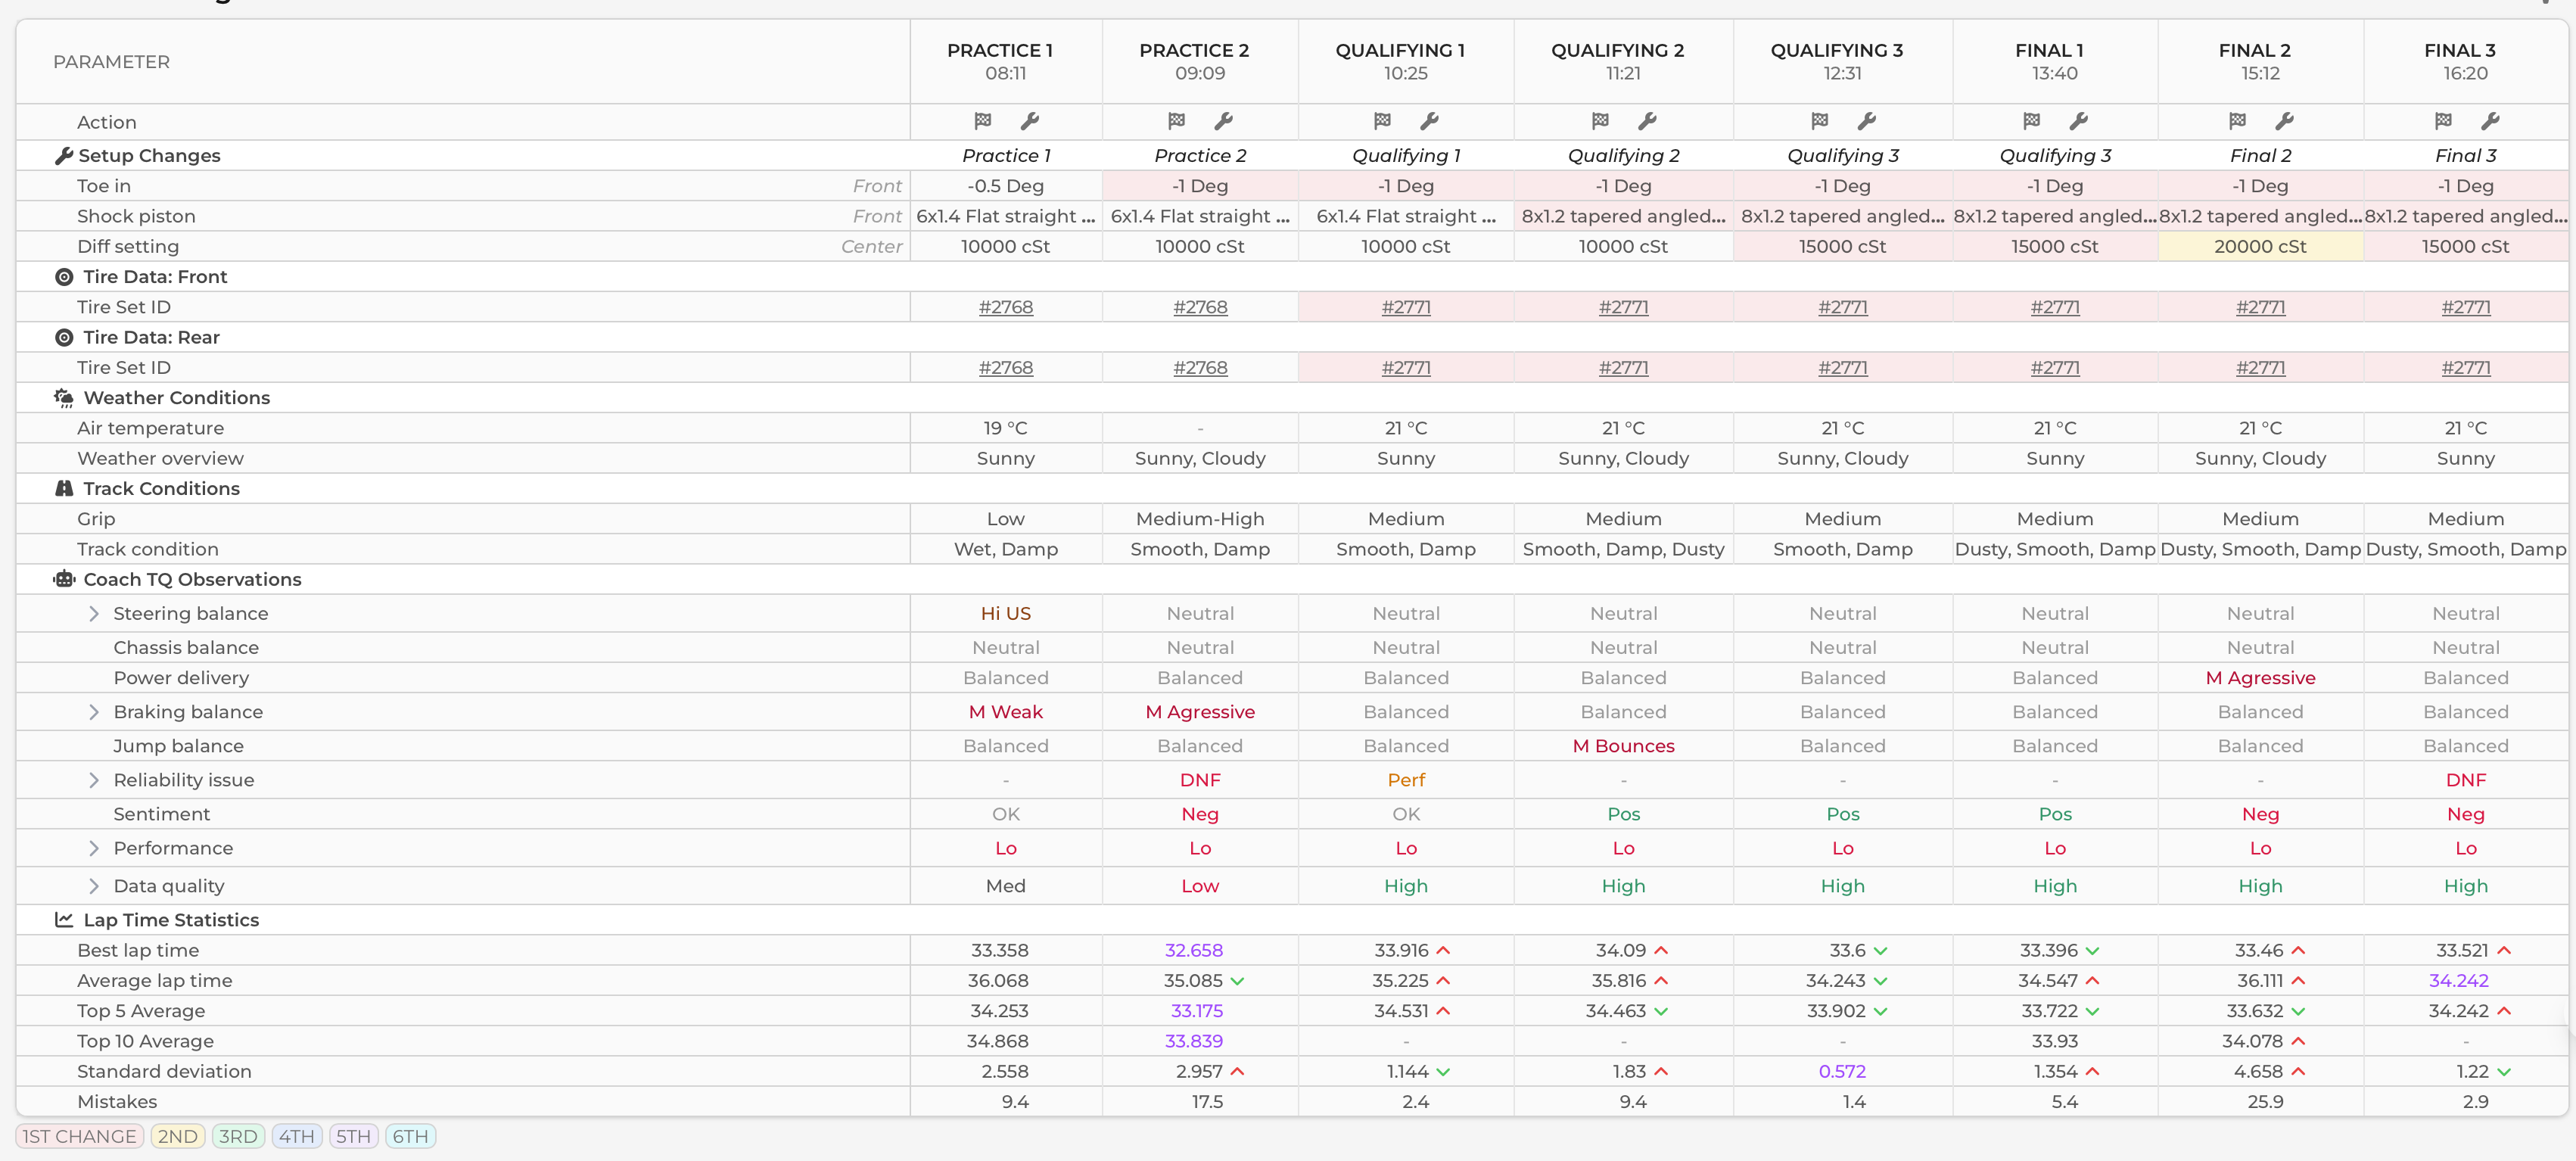
I used Collector Midi where I had sensors for steering, throttle/brake, 6-axis IMU for front and rear axle, rear wheel speed sensors, RPM, motor temperature, battery voltage and front damper potentiometers.
The relevant channels for this article were speed motor/rpm, speed rear left (RL), speed rear right (RR), damper position front left (FL) and damper position front right (FR). Speed channels are measured with 100Hz sampling rate and damper positions with 500Hz.
Setup changes and traces in data
I made a couple of changes on purpose to see how the change is visible in data. These are a bit advanced examples but the purpose is to show the potential of the system and you can go quite deep from a mathematical and statistical perspective.
Below you can find two examples for the setup change analysis. Keep in mind that my mechanical engineering skills are not sufficient to explain the setup change impact from a theoretical perspective. So the example cases focus on statistical perspective, relating the data to driver feeling and lap times.
The two examples show a few different methods for visualizing setup changes, how the changes showed up in driver comments and lap times, and what conclusions the data supported.
Summary
Here is my first article on data and key message I want to deliver is that curiosity will drive you forward. As a first step, check simple things. This opens more questions, and then you learn more and can go deeper with analytics by using more complex mathematics. Soon you will start to understand what things actually have an impact what are not relevant items.
Second key message is that performance and results depend on preparation, and this is where TestLogger wants to help you with Manager, Collector and Analyzer. Preparation takes time but is worth it. Race day is more relaxed, you open capacity to learn more and then finally you will start to bring results in long term.
One note about copying setups from other drivers. Like the data in related analytics examples show, there are many details in the car build which affect the car behavior and it should kept in mind.
If this article raises questions, I would be happy to do a follow up article to answer the questions.