
For the second qualifying I changed the front pistons from 6x1.4 flat (piston 1) with straight holes to 8x1.2 tapered angled holes (piston 2). I didn't make the change to improve the car, but just to see if I could see the difference in data. On the first qualifying I had issue with the FL damper which lost its oil. This gave a nice unintended addition to the examples.
We measure damper position but mainly analyze values derived from the position and the key value typically is damper speed. Below are multiple different statistics to visualize the differences that the piston change made.
Damper maximum speeds
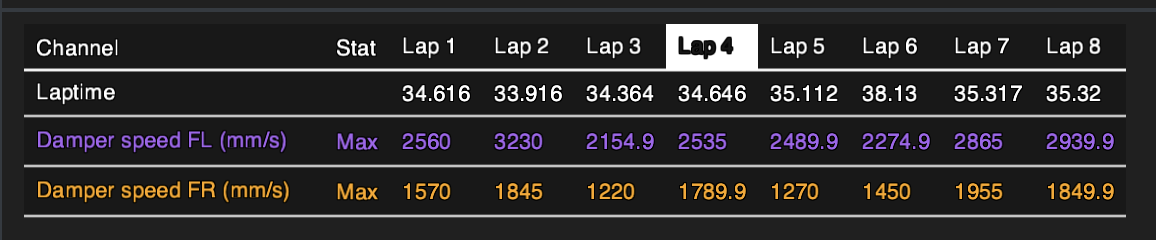
Below you can see tables with maximum damper speeds per lap, which occur in jump landings on this track. Looking at only one maximum value per lap doesn't tell much because the car lands every time in different angles, speeds and locations, but from the tables below I just wanted to indicate the data tells a story where maximum speeds can be measured and setting did impact the max speeds.
Piston 1 max speeds
The reference setup for start of the event

Piston 1 max speeds with oil leak in front left damper
Before the piston change I had an oil leak in the front left damper. This table shows why the measurement is useful for diagnostics: the FL max speeds run 2150–3230 mm/s against roughly 1400–1900 mm/s on a healthy damper. A leaking damper has less damping, so the shaft moves faster, and the difference is large enough to spot the fault directly from the data. Of course you will see this by opening your eyes and looking at the car, but it's also visible via data.
Piston 2 max speeds
Comparing piston 1 and piston 2, the FL max speeds drop from around 1600–1800 mm/s to 1300–1450 mm/s. A single lap doesn't prove anything, but across the laps the trend is consistent and points to more damping with piston 2.

Damper avg speeds per lap
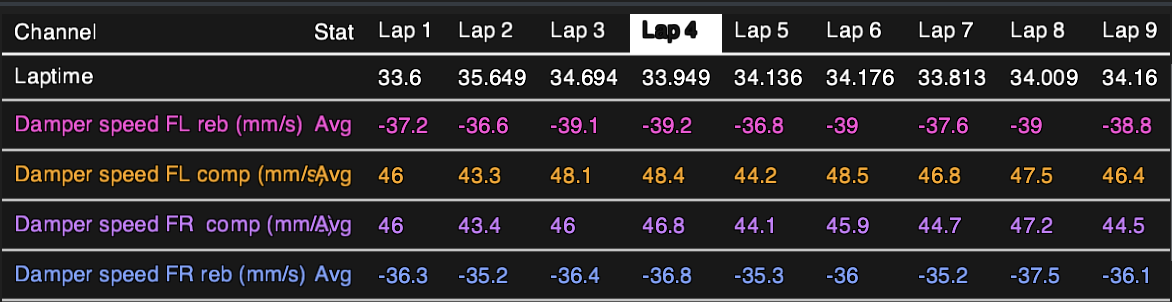
Below you can see average speeds for both rebound and compression areas per lap. The variation between laps is relatively small, so you could say that damper behavior change is minimal during a 5-10-minute run. It would be interesting to see how consistent the damper behavior remains for example between the first and tenth run.
Negative speeds are rebound side and positive are compression side of damper operation.
Piston 1 avg speeds for rebound and compression
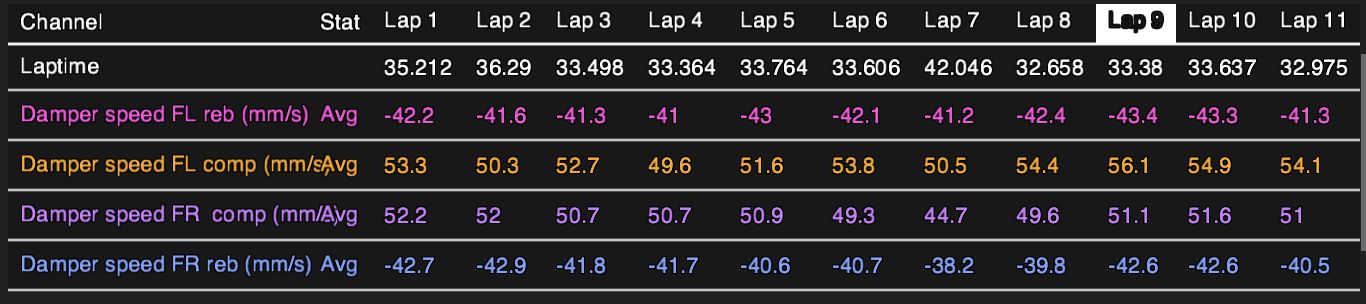
Piston 2 avg speeds for rebound and compression areas
Looking at the front left values, piston 2 has lower speeds in both directions: rebound goes from about -42 to -37 mm/s and compression from about 53 to 46 mm/s. Both moving down means the piston is adding damping across the stroke, not just on one side.
Comparing rebound to compression shows a small difference. Rebound slows down approximately 5 mm/s (11.9%) and on compression side the difference is approximately 7 mm/s (13.2%). The reduction is slightly larger on compression side, which is interesting as we changed to tapered piston. Let’s see if other statistics show anything else.
Damper position vs speed
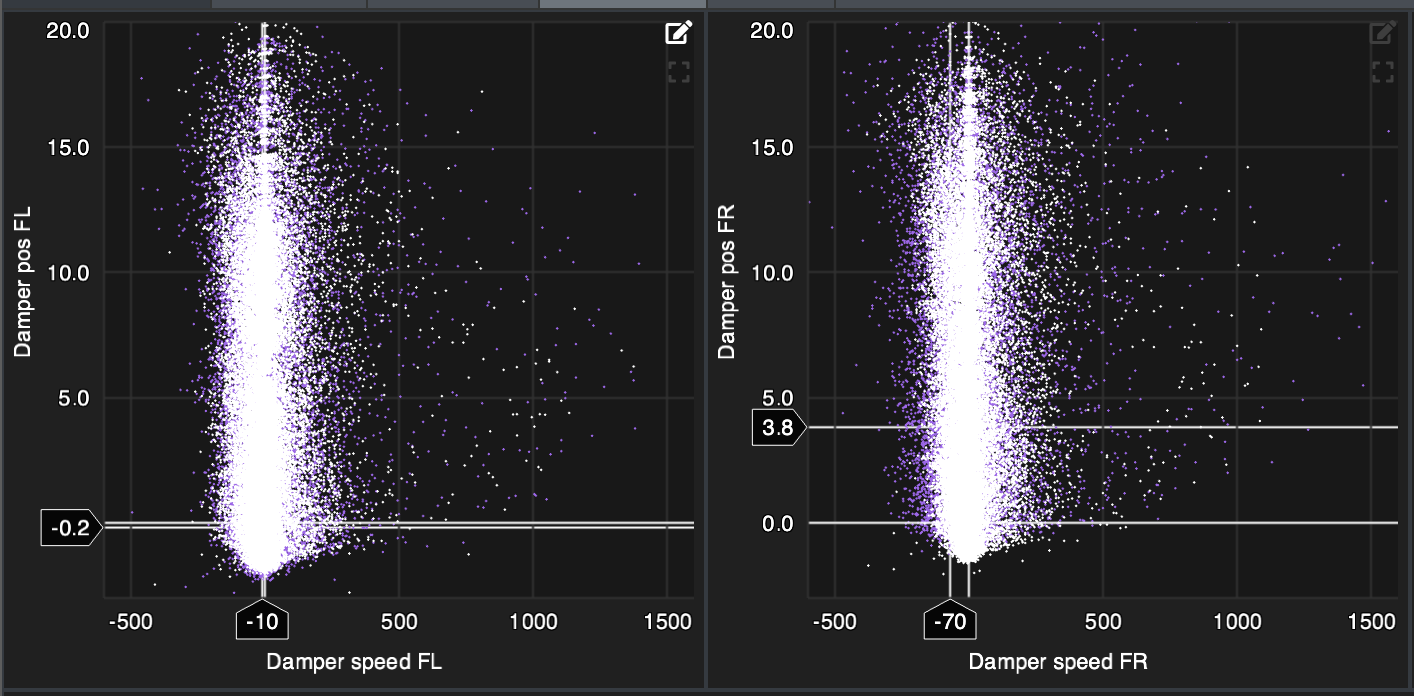
The images below show the damper position in relation to damper speed as XY scatter plot. Purple trace is Piston 1 and white is piston 2. On the position axis (Y-axis) 0 is full droop (goes negative due to droop adjustments made after calibration) and 20 mm is full compression.
On both images you can see the rebound side to have lower speeds with piston 2 quite linearly compared to piston 1. This would mean the damping is higher, which makes sense.
Damper speed histogram and statistics
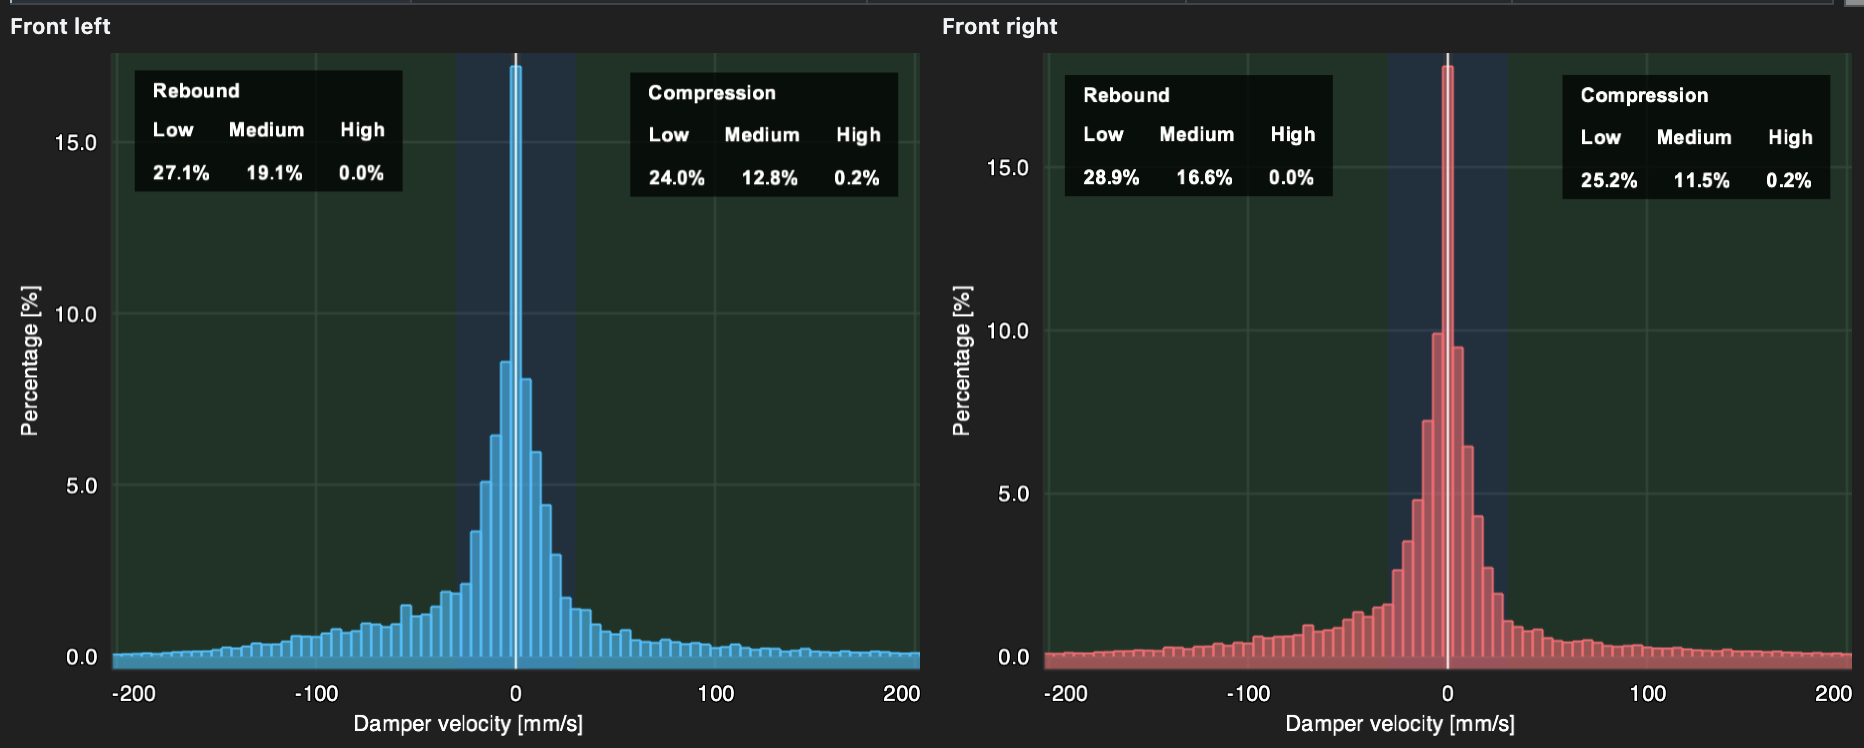
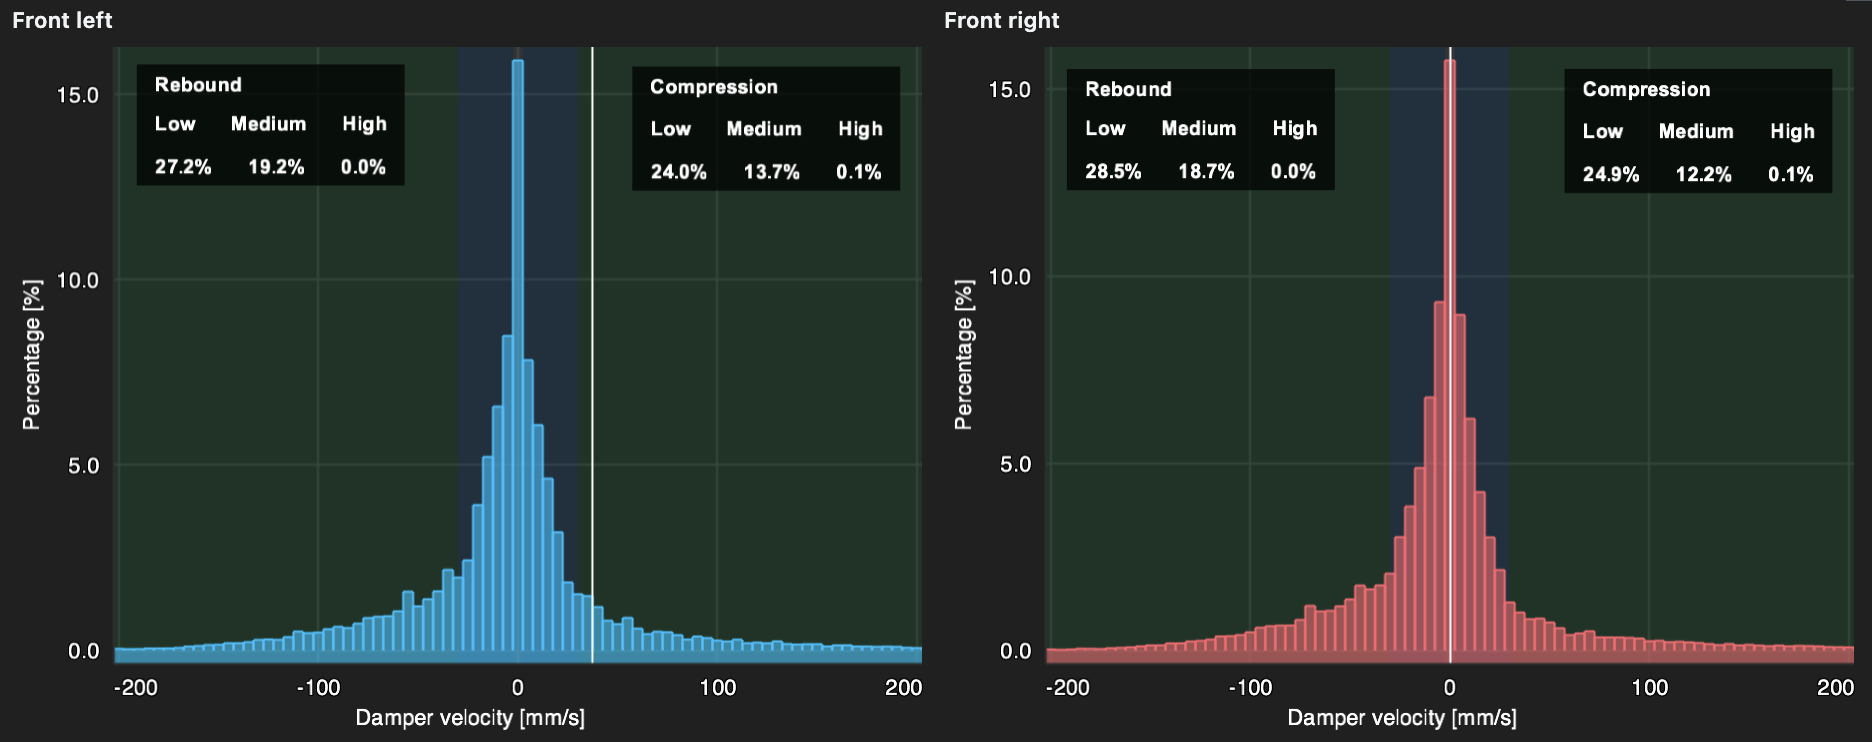
Damper histogram is one of the key tools for damper analytics. Analyzer provides a built-in tool for damper histogram. The statistics table will give you time spent on the speed range and average speed per range. In addition the element calculates overall average speeds for rebound and compression, histogram skew and 99 percentile for statistical number for jump landings. The speed bands are a combination of full scale racing and my own adjustments based on findings from data.
|
Name |
Range |
Description |
|---|---|---|
|
Friction |
0mm/s - 2.5mm/s |
Very slow movements |
|
Low speed |
2.5mm/s-30mm/s |
Cornering |
|
Medium speed |
30-400 mm/s |
braking, acceleration, bumps, takeoffs |
|
High speed |
> 400mm/s |
Jump landings |
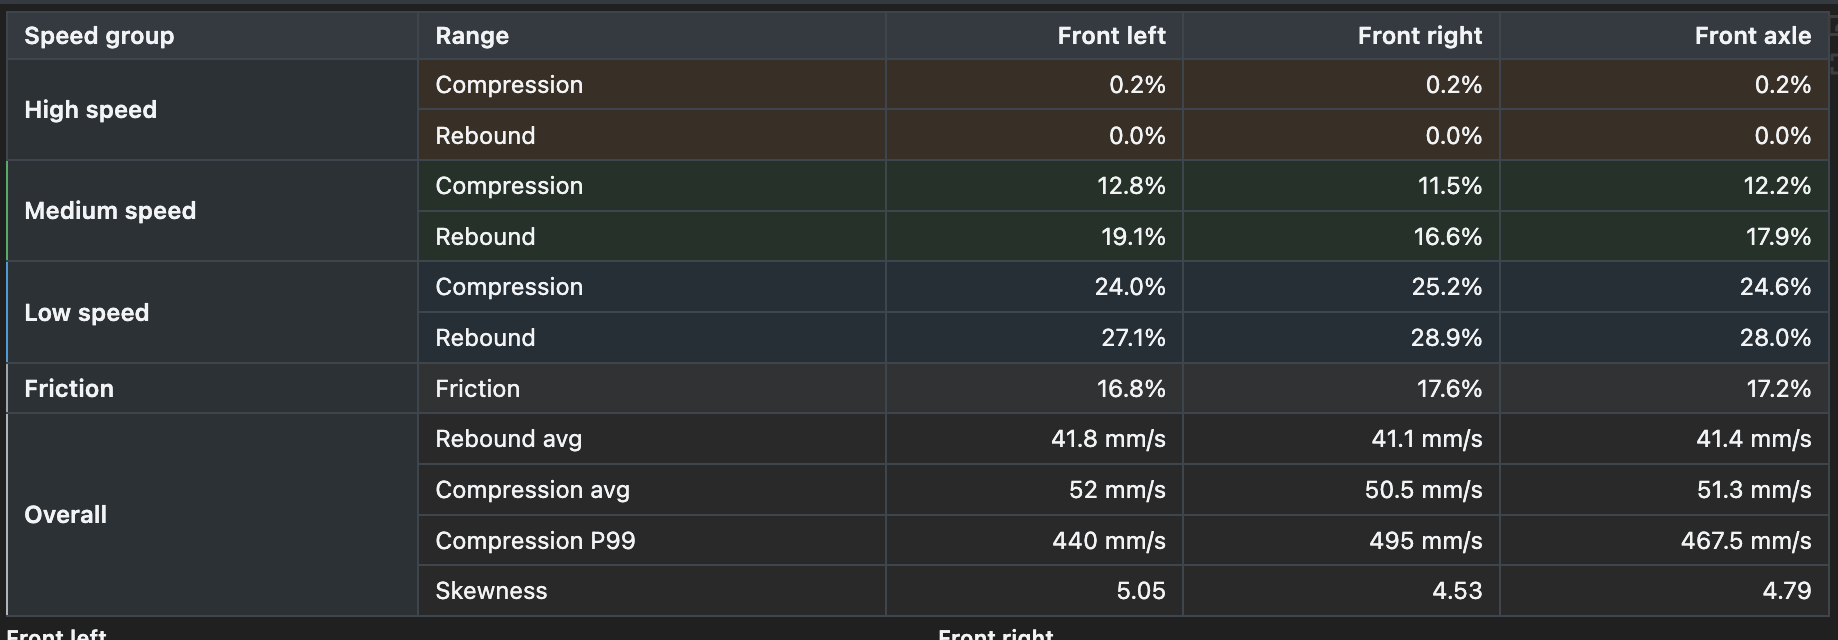
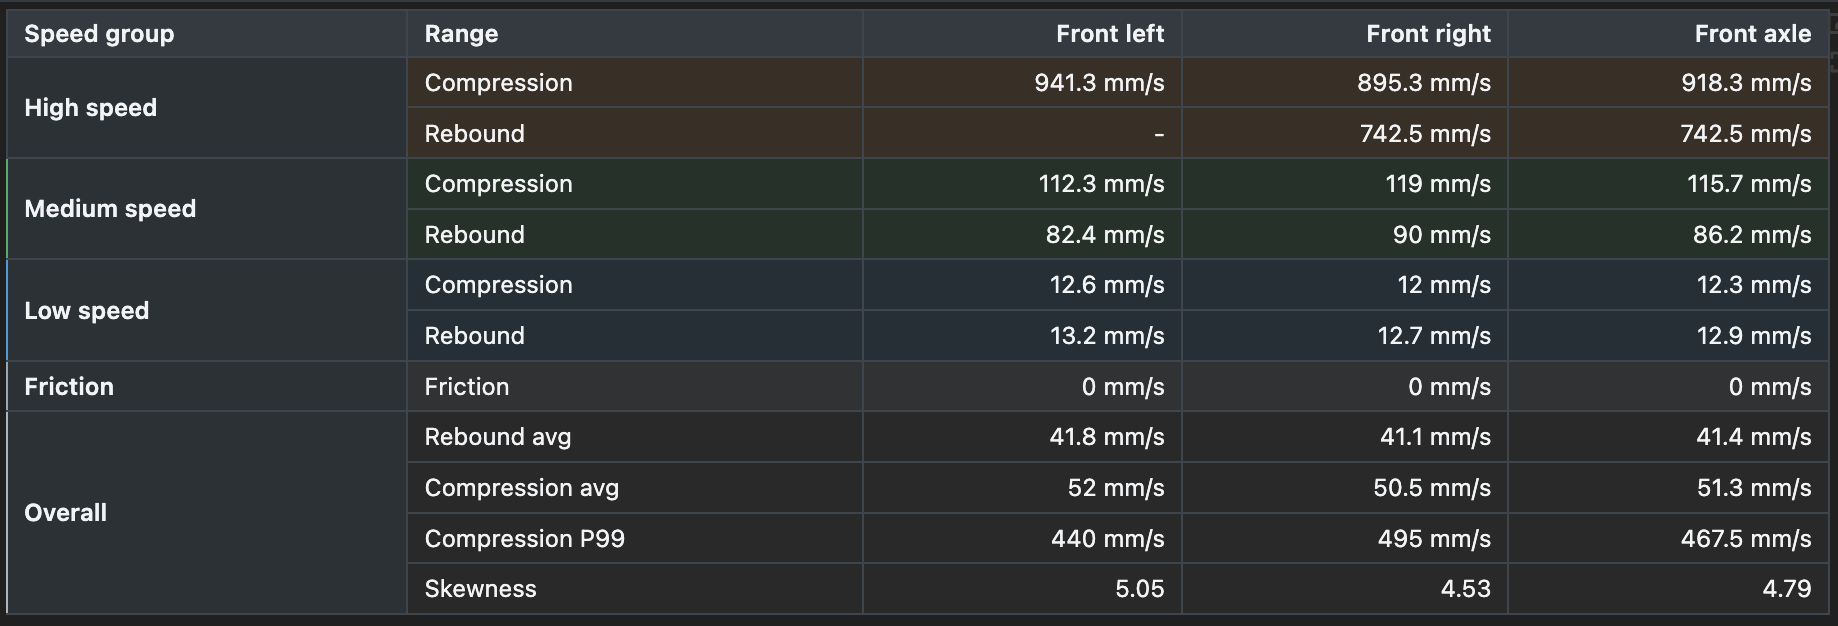
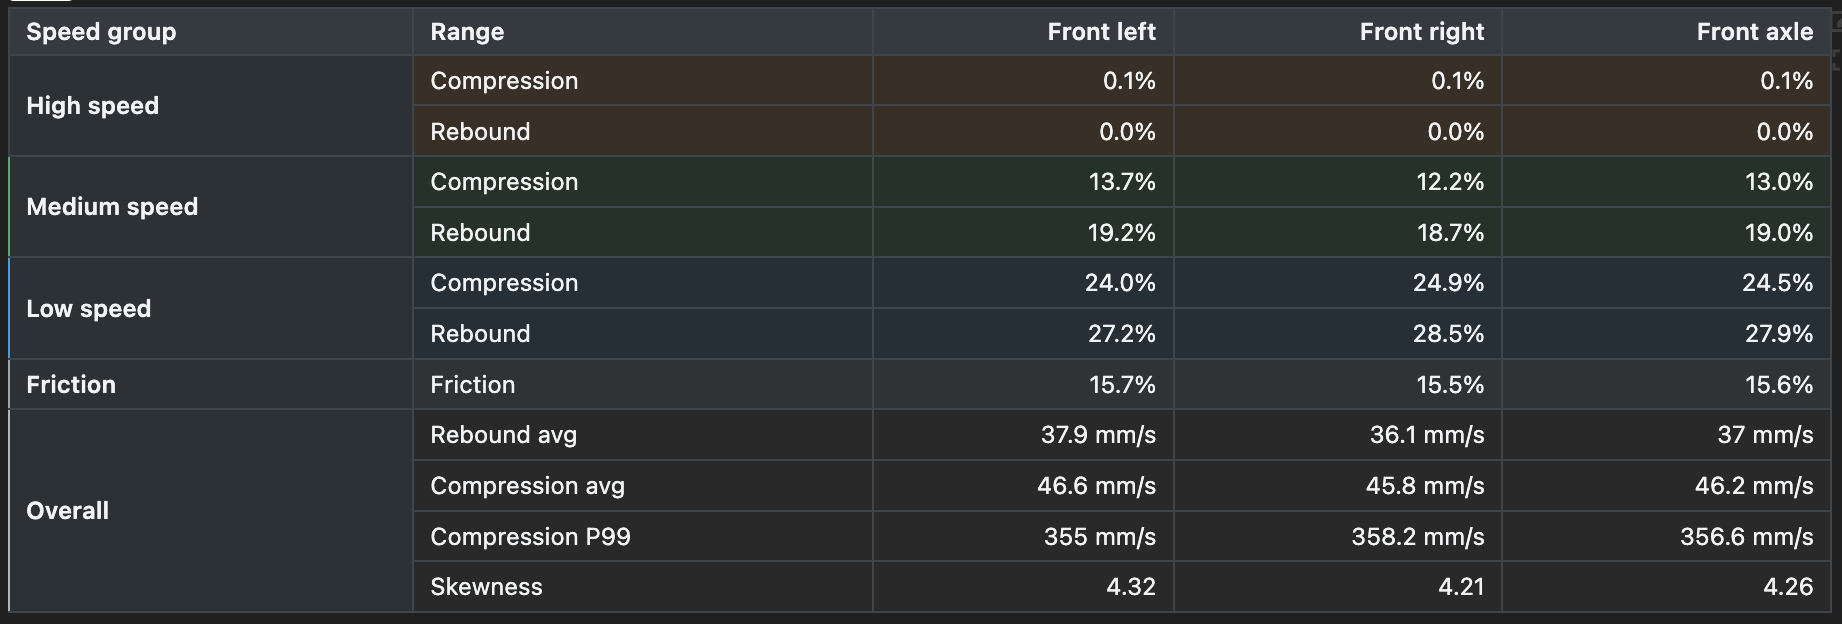
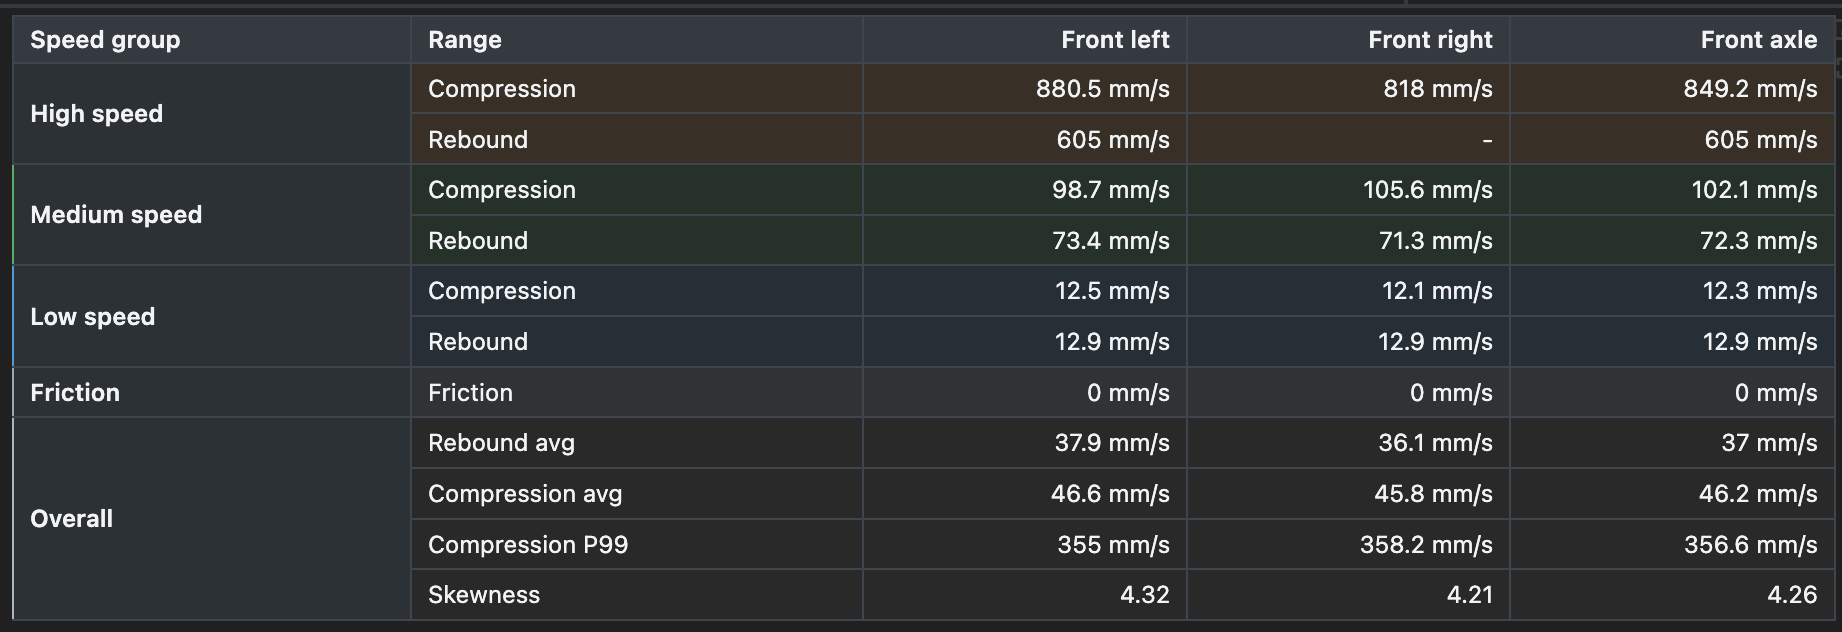
There are two tables per piston. The first shows the percentage of time spent in each speed band, so you see where the damper operates. The second shows the average speed within each band, so you see how fast it moves when it is in that band.
The Friction row is the near-zero band when the shaft is barely moving.
Skewness measures how uneven the speed distribution is between rebound and compression. A higher number means one side reaches much higher speeds than the other. Piston 1 sits at 5.05/4.53 (FL/FR) and piston 2 at 4.32/4.21, so piston 2 is more even between the two directions. And this was anticipated with the tapered piston.
Compression P99 is the speed below which 99% of compression samples fall. It is less sensitive to a single extreme sample than the absolute maximum and is therefore useful for comparing high-speed events and typically in offroad this happens at jump landings.
Piston 1 statistics per speed range
Piston 2 statistics per speed range
Driver feedback and laptimes
Steering was more precise with new front pistons. Balance in general was good. Three or four rolls in jump landings.
How did this correlate to actual performance? Comment above states that steering was more precise but it’s very likely that feeling partially came from the fact that the previous run had a leak in the front left damper. Also more rolls on jump landings. All these indicate there was too much damping.
“Lap times didn’t look good either. Pace was quite the same but consistency was massively worse and increased mistakes after changing to piston 2. Below are stats about lap times for practice 2, qualifying 1 and qualifying 2.



Conclusion
The piston change did have an impact on the behavior and with calculations you can clearly get actionable numbers out from the data. Clearly piston 2 increased the damping on medium and high speeds (P99 speeds dropped around 24%) and reduced the positive skew by approximately 11% between rebound and compression. Then of course the question is what the optimal numbers are and that is impossible to answer with this experience.
You also need to consider lap times and driver feedback. This is where the power of TestLogger comes into play when you can collect data and metadata like comments into one place.
When you pull everything together, I would go back to lighter damping in front but keep the tapered piston as the expectation is that it reduced the skew.