Comparing Collector with GNSS-based loggers
GNSS-based loggers have been available for some years including RaceBox Micro and Dragy Lite. A few weeks ago I added support for opening VBO files in Analyzer which both RaceBox and Dragy can export. This enabled me to do a comparison between these two devices and TestLogger Collector.
One fascinating part of data logging is understanding which sensor to use for which use case and what pros and cons each method has. In reality there is rarely a perfect solution for a given use case and often you need to figure out the best compromise on what to measure. Let’s take an example from steering. In the end you would be interested in steering angle when analyzing e.g. steering balance, but it’s difficult to measure. Therefore you measure the steering input from the receiver and measure the steering angle with different steering inputs, so in the end you use either a formula or a lookup table which gives a good enough approximation of the actual steering angle.
The purpose of this experiment is to compare the sensors and see where they differ.
Test setup
I did the test at the Jyväskylä off-road track with my Team Associated RC8B4e. I had Collector Midi installed with RPM and wheel speed sensors. On top of the center diff I had both RaceBox Micro and Dragy Lite installed, so the receiver antennas had good sky coverage.
The weather was good with a clear sky and the track itself had no tree cover, and the surroundings were approximately 80% open area, so conditions were quite optimal for GNSS. The track was very bumpy and had a lot of loose dirt on top, which is pretty much the worst possible scenario to analyze wheel speeds.
Evaluations
Ease of setup
Both RaceBox Micro and Dragy Lite were very simple to set up. Basically you download the mobile app, create a track with a lap gate, connect to the sensor and start recording. Device installation is easy as RaceBox just gets power from the receiver port and Dragy Lite has a battery, so it doesn’t need a cable to power the device. Of course, the battery needs to be charged.
TestLogger Collector on the other hand is a lot more complex to set up, because it has separate sensors that require calibration and configuration. For GNSS boxes the setup is probably 15 minutes and for Collector it can be up to 3 hours. We need to improve this area, but in our defense this is something you do only once. The risk with Collector is that a mistake in the config leads to logging wrong data.
Not directly part of the setup, but with GNSS sensors you need to wait quite a while for the signal to stabilize and maximize the position accuracy.
Lap times
The first thing that caught my attention was that each device recorded different lap times.
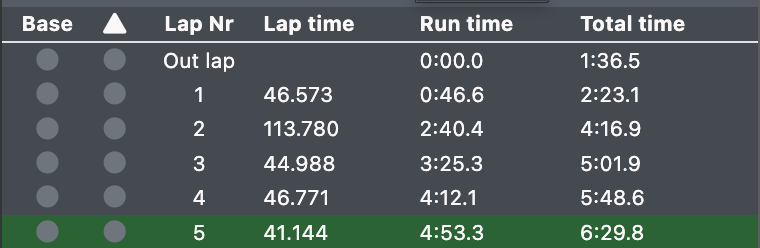
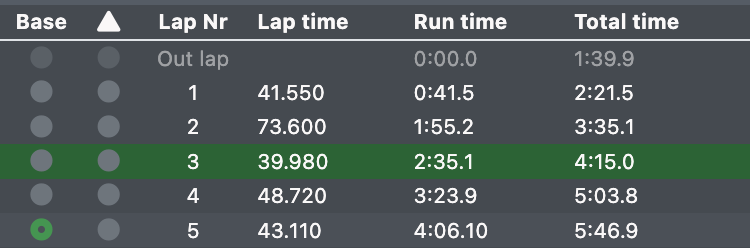
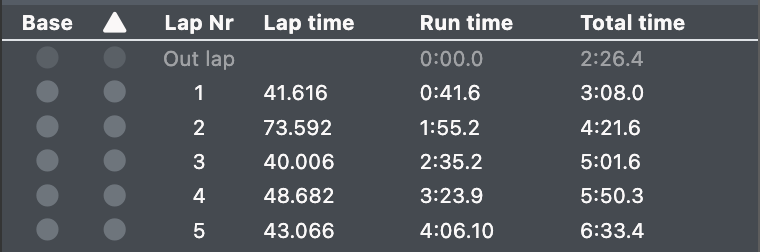
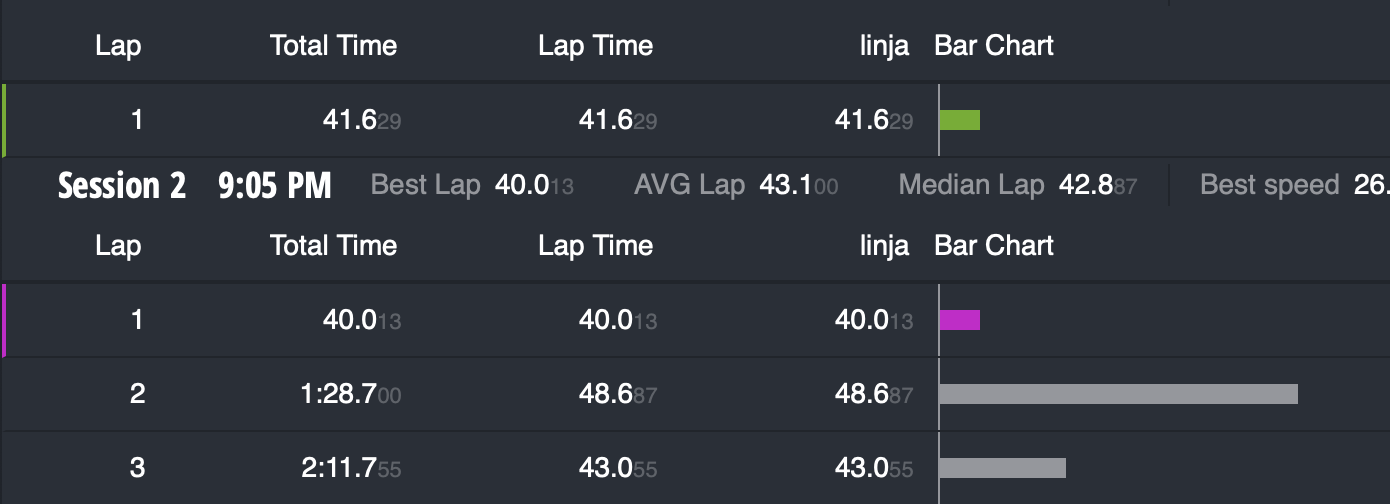
We can consider the MyLaps times as ground truth as that system is used pretty much everywhere and is a very solid system.
Collector beacon times are within 0.005-0.013 seconds of MyLaps and Dragy within 0.033-0.079 s. RaceBox laps were several seconds off. RaceBox’s issue seems to be GNSS accuracy and it detected the lap trigger gate in the wrong part of the track.
For reference the long second lap was a roll that needed a marshal.
| Source | Min difference | Max difference |
|---|---|---|
| Speedhive | 0 | 0 |
| Collector | 0.005 | 0.013 |
| RaceBox Micro | N/A | N/A |
| Dragy Lite | 0.033 | 0.079 |
The smallest difference is with Collector and Dragy Lite is not far off. I would say the difference doesn’t impact the analytics. As RaceBox is quite far off, we can say that GNSS lap times require a high-quality signal to be accurate.
Maybe the key challenge with GNSS is to understand when you can rely on the lap times when that is the only source. In data tools it can be checked and corrected but that requires some extra work. Similar issues can happen with infrared as well, where you miss laps and then you need to manually place the lap triggers.
Accelerometer
The accelerometer was compared between Collector and RaceBox. Unfortunately the Dragy Lite export doesn’t include accelerometer data.
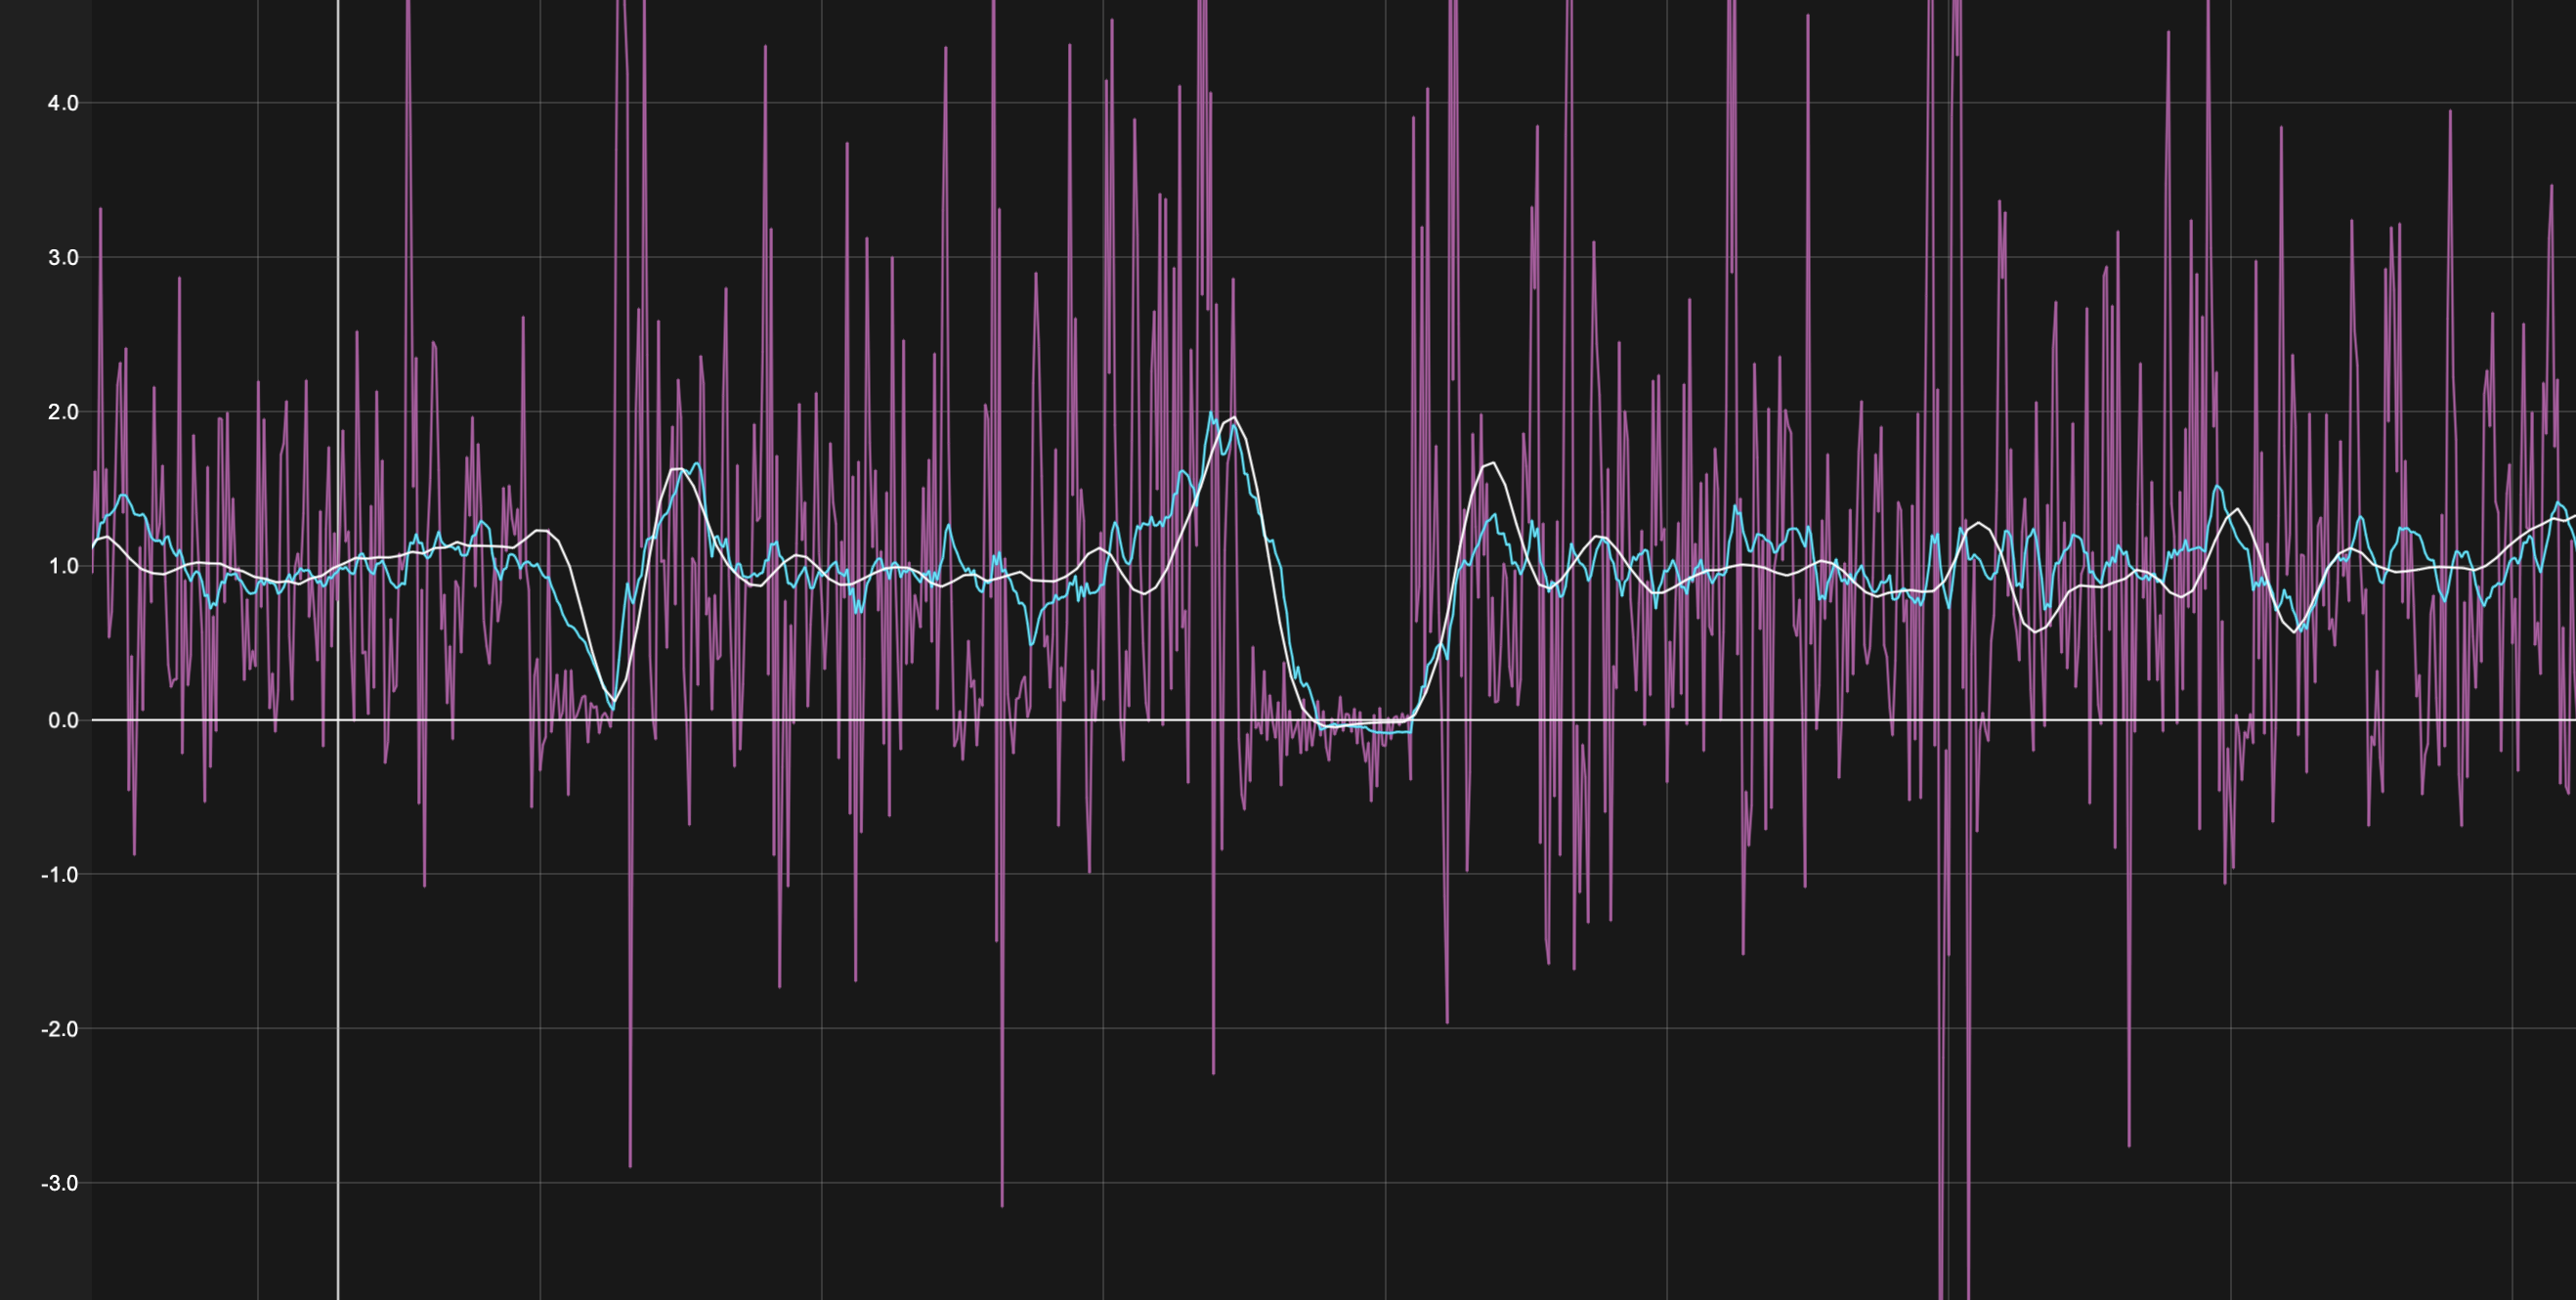
The comparison reveals very clearly how much the data is filtered and smoothed on RaceBox. Below is an example where Collector’s raw signal, filtered signal and RaceBox signal are overlaid.
The smooth RaceBox signal is easy to read and in most cases sufficient, but at the same time it loses a lot of detail. This itself is not necessarily a problem because acceleration data is filtered in most cases, but it leaves the user very few options to see more details and RaceBox users don’t know how much the data is filtered.
GNSS accuracy
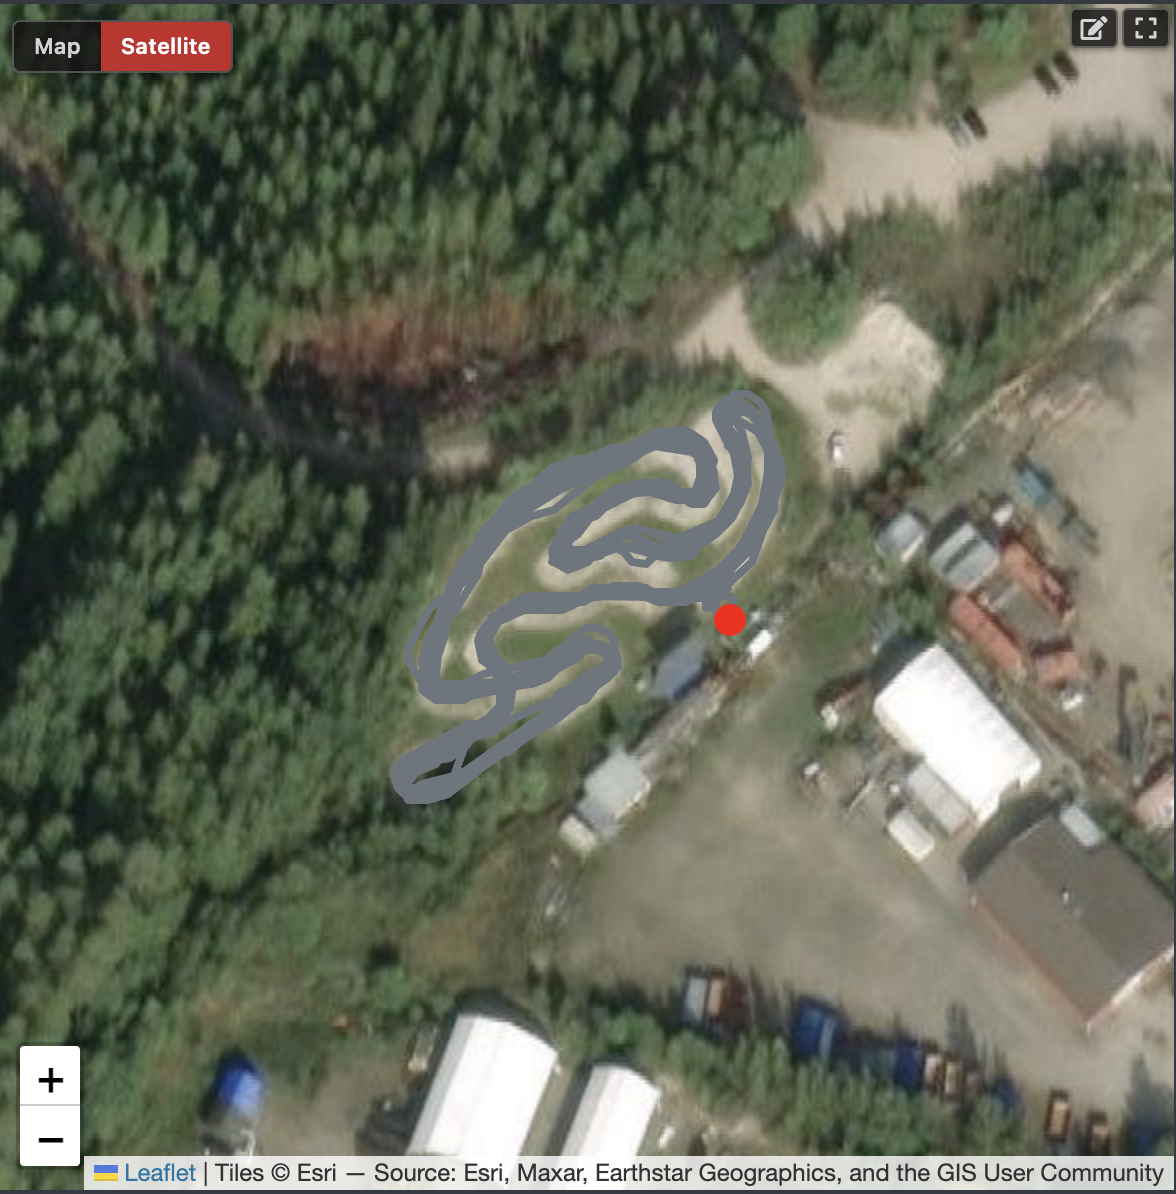
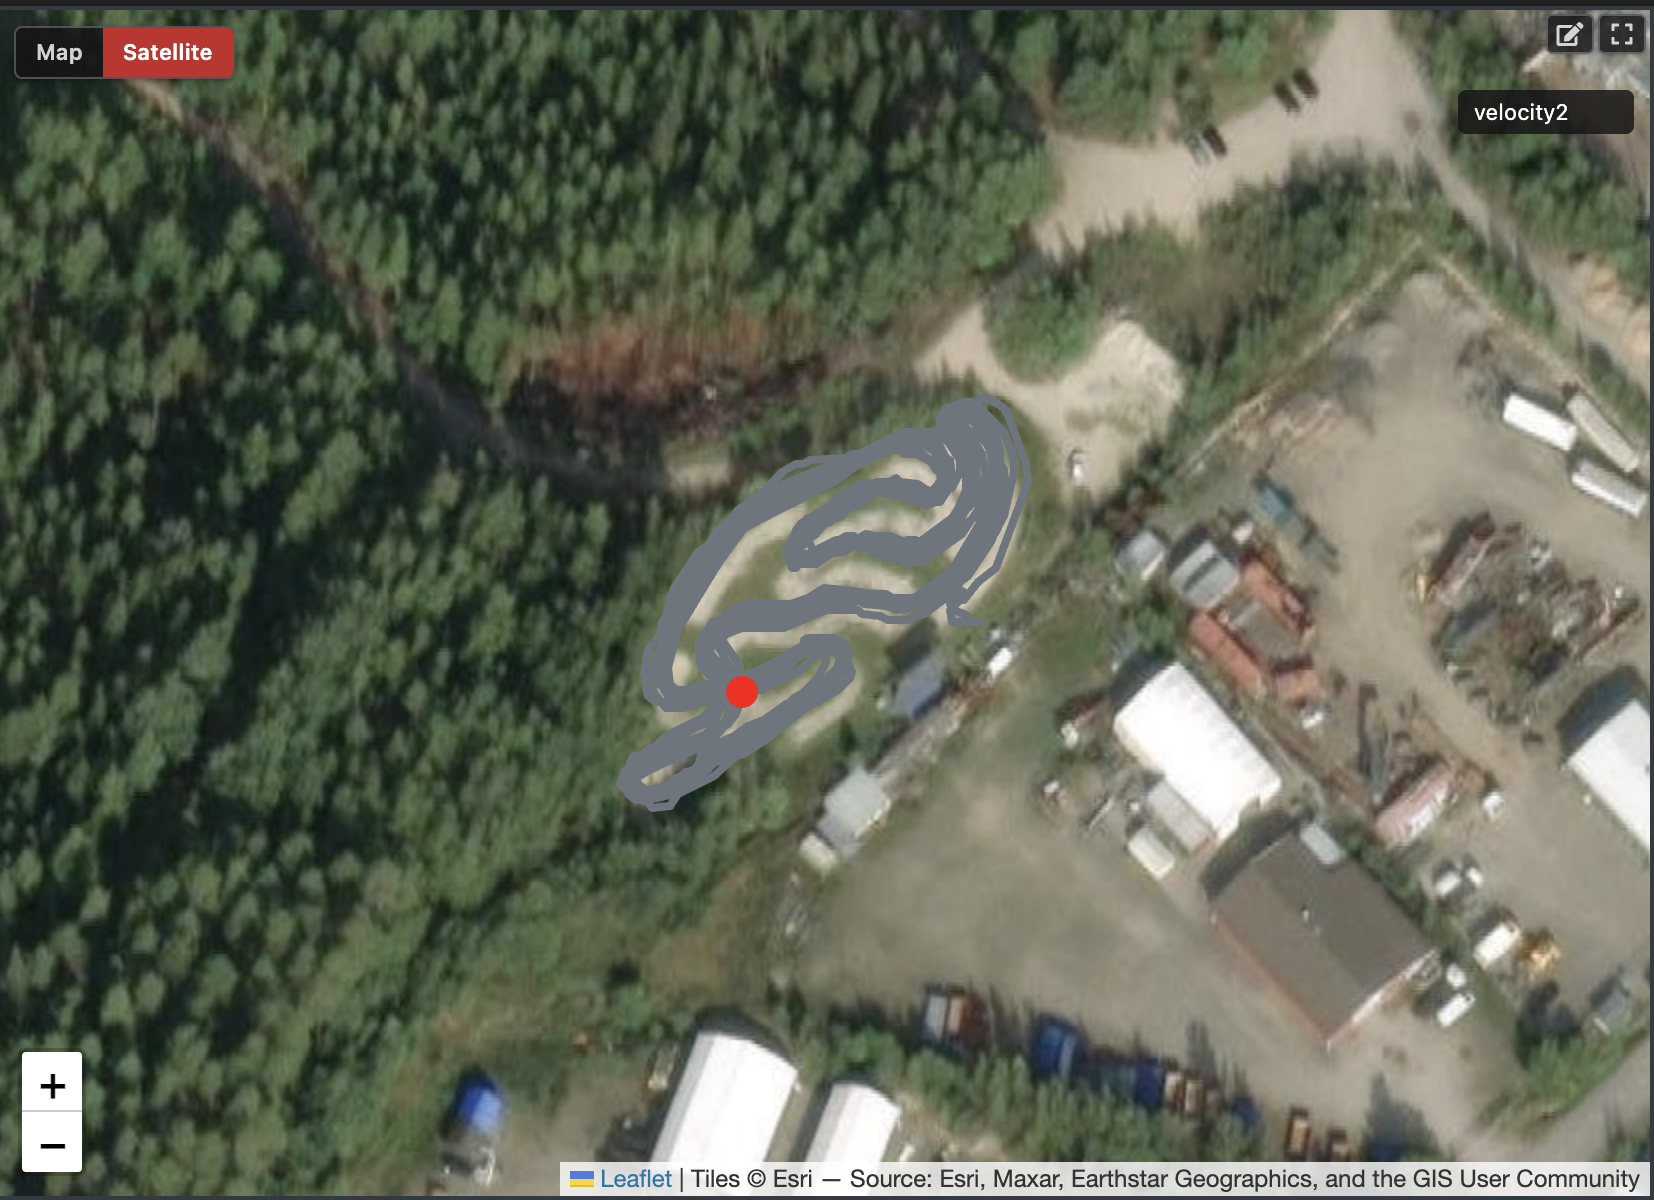
GNSS accuracy wasn’t the primary topic of this article as I don’t have good tools to compare GNSS data from different devices and Collector doesn’t have GNSS support. But just by looking at the images below, we can see Dragy’s line is thinner, so the GNSS variance is lower and also the offset is smaller on Dragy. But this is also seen with lap times as RaceBox was using the lap gate from the wrong location.
When I did a similar test on the street at home, the RaceBox Micro was way better in accuracy, but there was still a lot of variation even I was driving exactly same path all the time.
In RC racing, utilizing the GNSS trace for driving line analytics is very challenging because there is too much variation in the accuracy. But at the same time you have to remember that it's still more than Collector provides, as there you rely only on calculations based on the Inertial Measurement Unit (IMU) and speed.
It looks like the devices are using different GNSS receivers. RaceBox is using the u-blox SAM-M10Q and Dragy is using the u-blox MAX-M10S which might explain the differences in accuracy. One indicator for it is the number of satellites available. The blue line shows the number of satellites with Dragy and the white line shows the number of satellites with RaceBox.

Speed accuracy
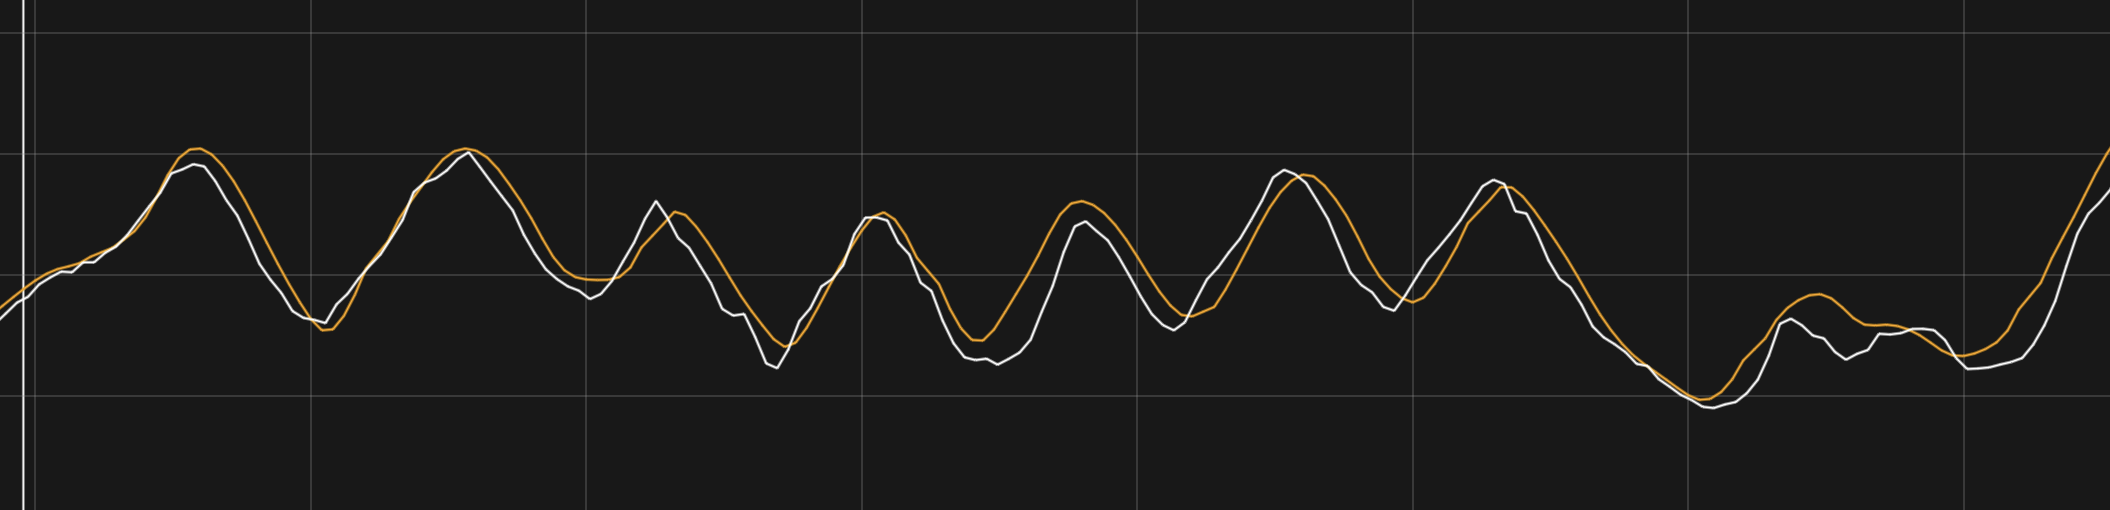
Before I went to the track, I did a small test at home on the street as mentioned earlier. In the test I was doing a small loop with the same sequence over multiple laps. This scenario is not the best one for GNSS as the speed transitions were very quick. The interesting part is that speed varies between GNSS devices. When you compare either GNSS device to the Collector speed measurement you can clearly see the heavy filtering, but as said, this doesn’t reflect the real situation on track where speed transitions are smoother. The wheel spin on this test was quite minimal as the test was conducted on asphalt using a battery which was close to empty.
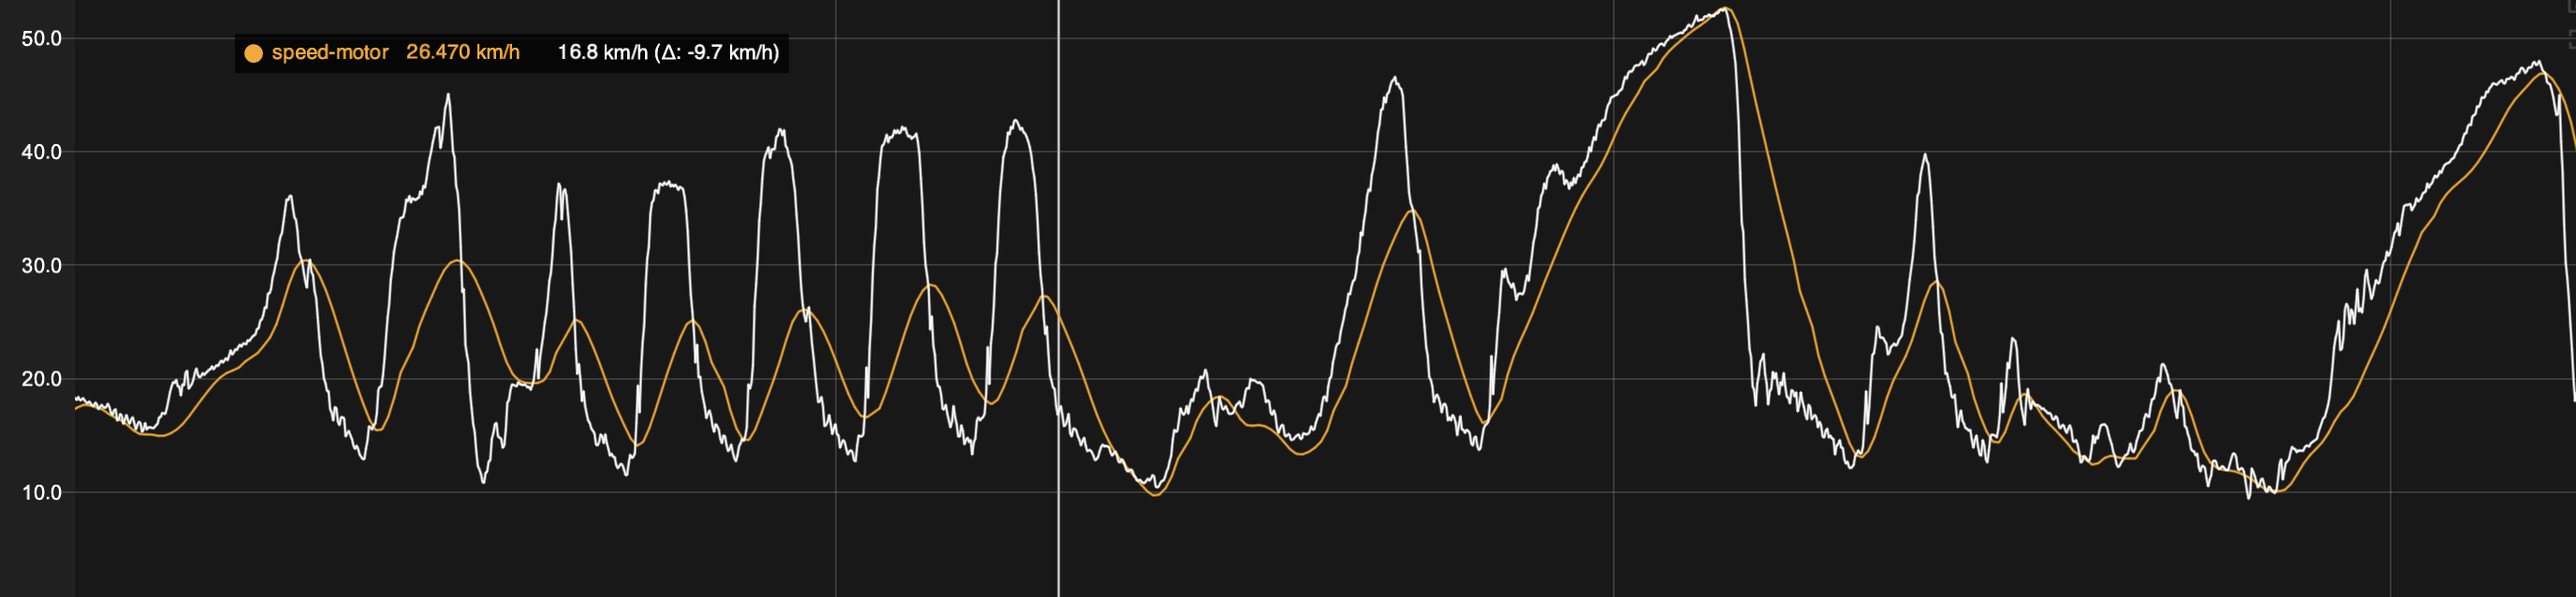
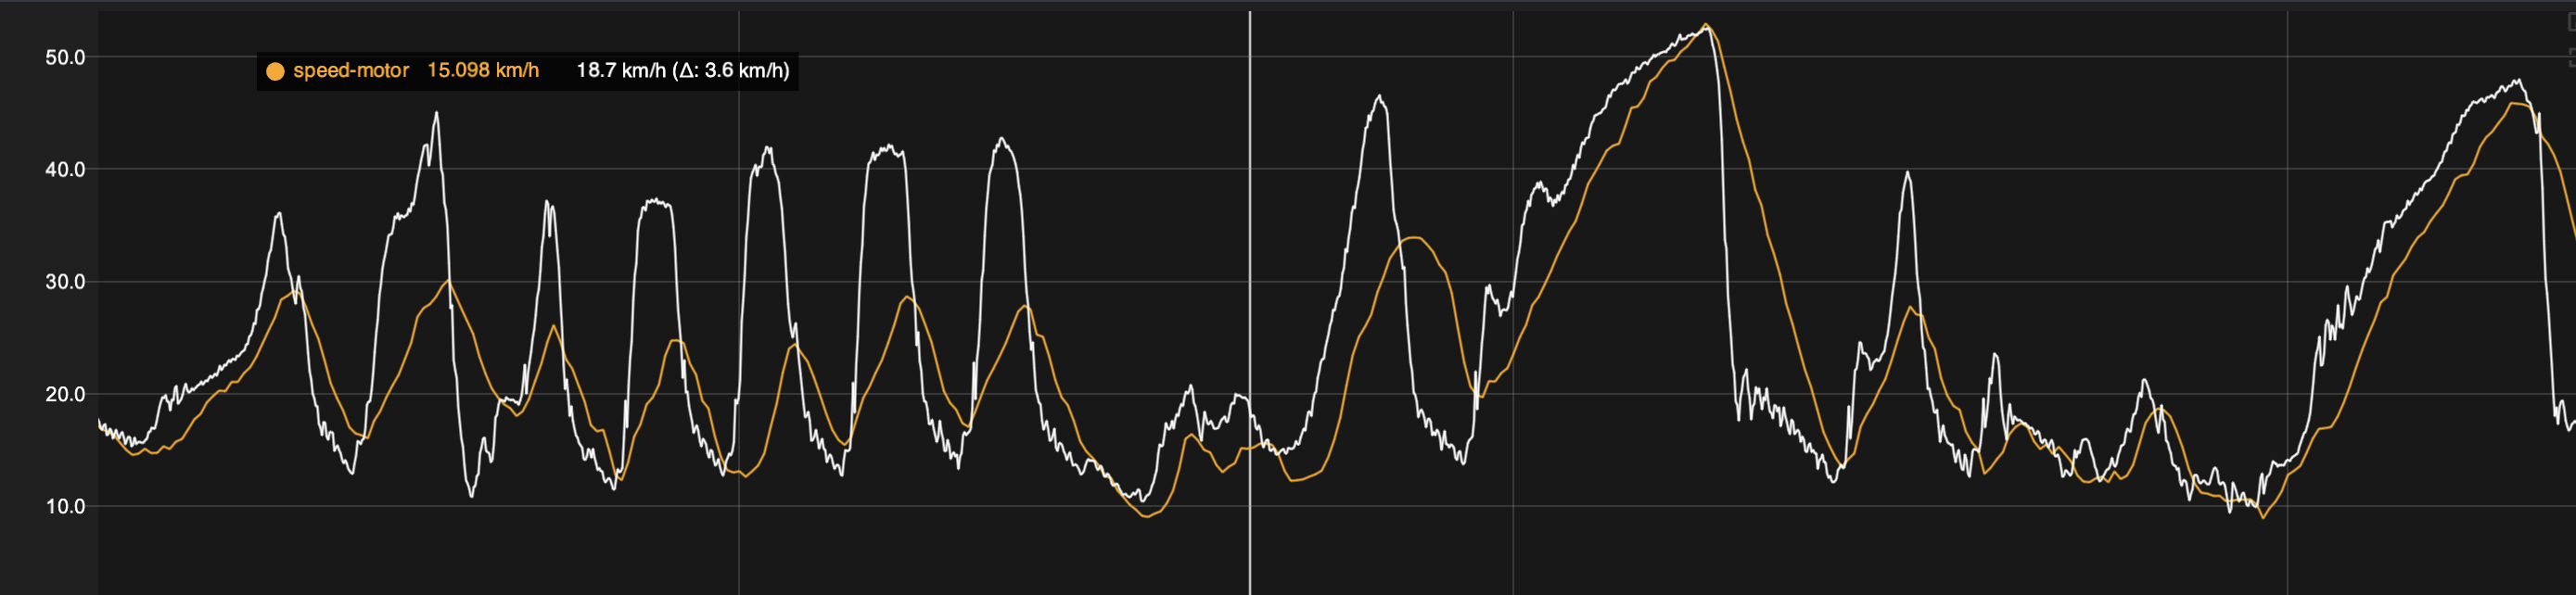
Doing the test on track was a lot more interesting use case because speed transitions are slower and off-road has a lot of wheel spin and jumps.
Below are screenshots where Collector speed trace is compared with RaceBox and Dragy Lite. Collector speed trace is the average of all speed inputs (red). GNSS sensors have a single speed trace (white).
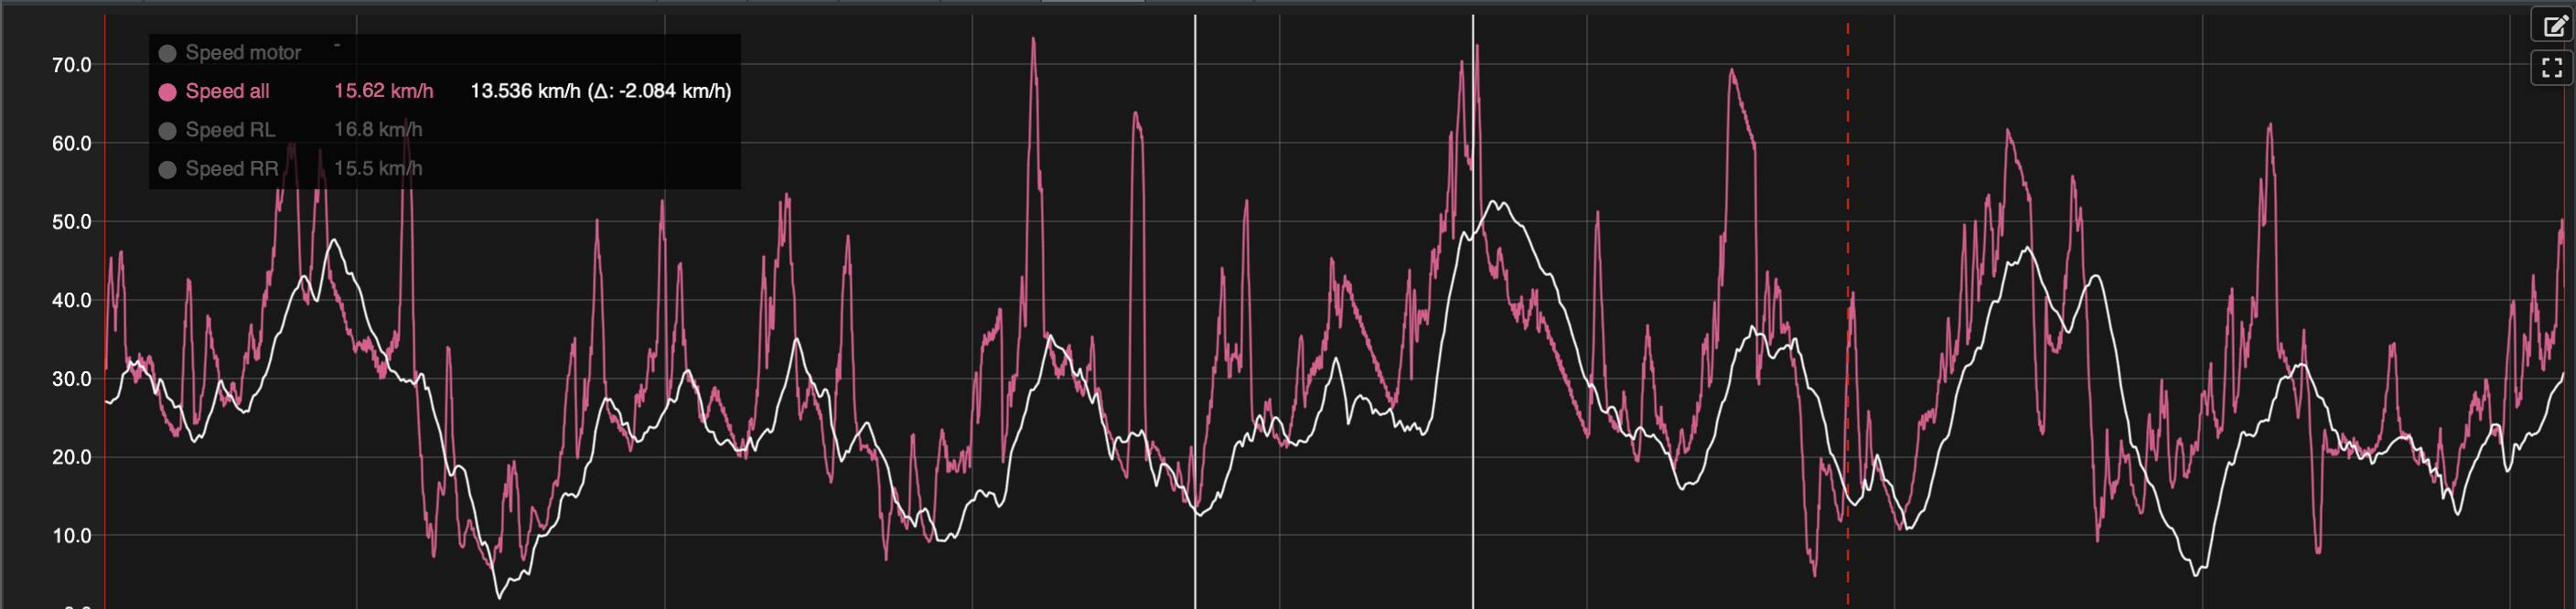
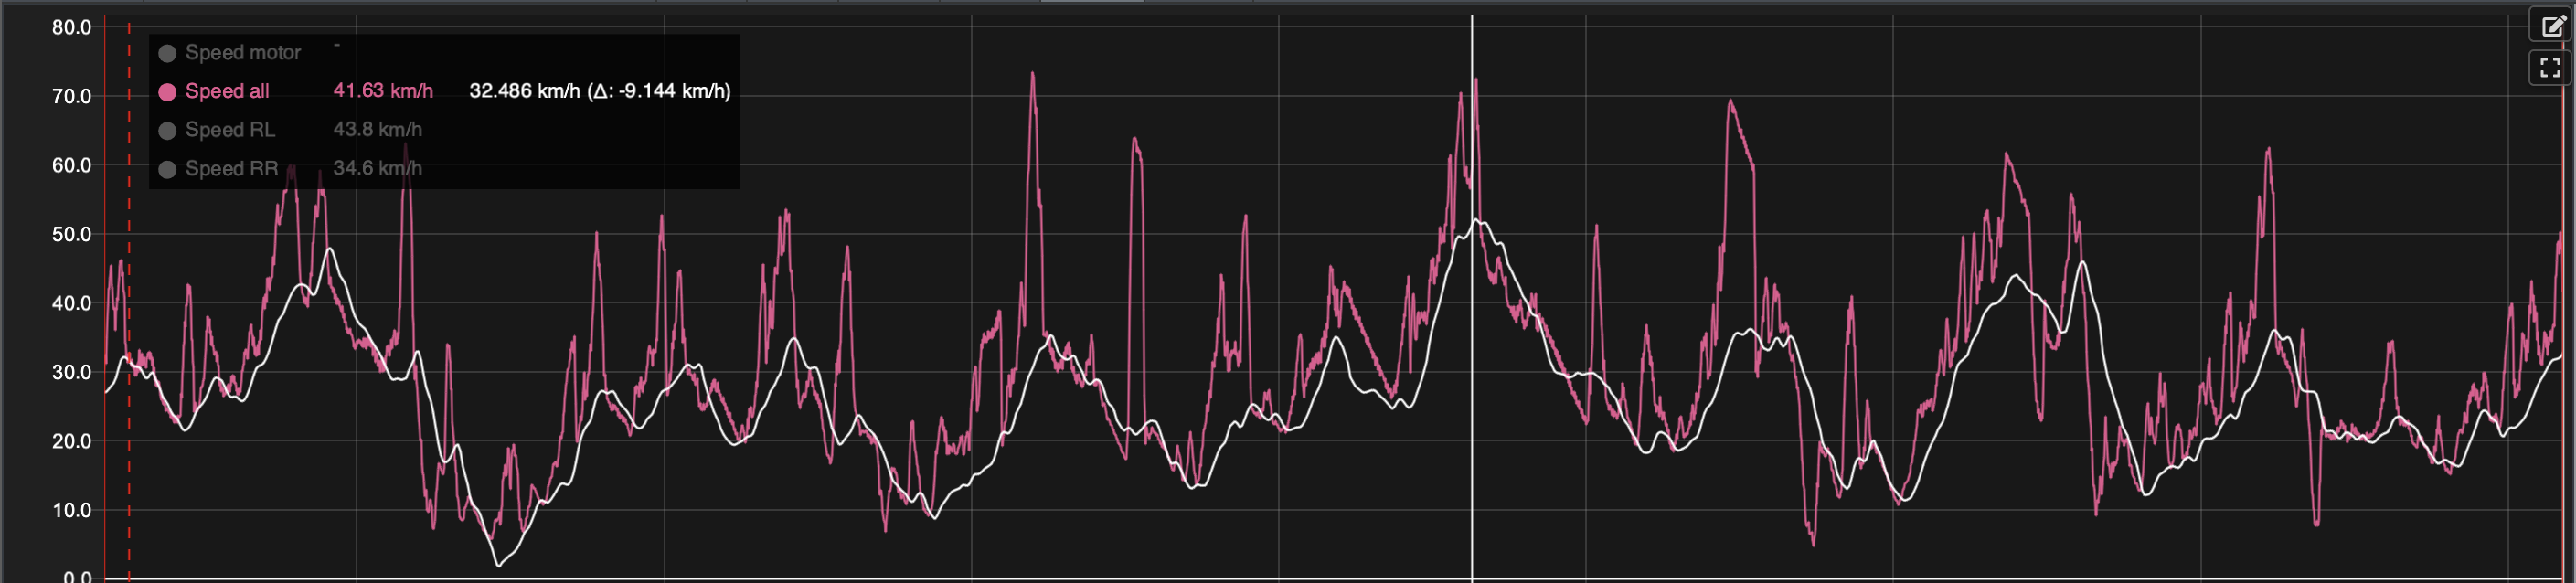
One thing that is consistent with GNSS sensors is lag at racing speeds. Dragy lag varies between 0.1 and 0.2 seconds and RaceBox lag ranges between 0.1 and 0.3 seconds. I checked the lag from corners where the speed is smallest so we avoid wheel spin distorting the analysis and from some higher speed corners. I didn’t spend too much time on analyzing what causes the lag, but I would suspect it is a combination of direction changes, speed changes and the number of satellites available.
You might ask if the data is aligned correctly, but with RaceBox it can be verified by using the vertical acceleration channel. Vertical acceleration channels were aligned in jumps so we can conclude that speed is aligned as well. Dragy’s alignment couldn’t be verified with vertical acceleration as that wasn’t available. Both RaceBox and Dragy speed traces were aligned to Collector speed trace where speed started to increase from standstill.
This lag makes analytics very tricky because the speed is not aligned with other data channels which can lead to wrong conclusions on what happens for example in the corner exits. If the lag is for example 0.2 seconds and speed is 40 km/h, then car the travels 2.2 meters in that time which is a lot in RC corners. The lag would be interesting phenomena to research with own GNSS receiver if the lag comes from filtering or is it the nature of GNSS. Maybe next summer I will have time for some research…
When I compare the speeds in areas where the car is coasting, the speeds are within 0.5 km/h with Dragy which is very good and around 1.0 km/h with RaceBox which is good as well. All three methods can introduce noise to the data so I would say that all three devices measure the correct speed when conditions are right.
As soon as the transitions get faster, you immediately start to introduce lag and lose some of the details from the speed trace with GNSS receivers. One annoying thing was that sometimes Dragy was following the same speed curve during acceleration and sometimes without any sensible reason the speed curve stayed around 25% lower than Collector speed curve. The same issue happened with RaceBox where the speed trace was just significantly off. In those cases there was no evidence of wheel spin, and the other GNSS was following Collector speeds much better.
Overall, with Dragy having over 25 satellites available, the data is good quality for analytics even though there is a small delay. With RaceBox having around 15 satellites in use, it is very hard to trust the numbers in many places.
Measuring the speed from motor or outdrives creates the problem that wheel spin is not giving correct speed during acceleration, but at the same time it gives valuable information on drivetrain and suspension behavior. This requires more understanding as you can’t just check what speed values you get, but also need to understand what really happens to utilize the speed trace and the real speed is often at the drops you see in the speed trace. But depending on the use case, the wheel spin can be a major downside.
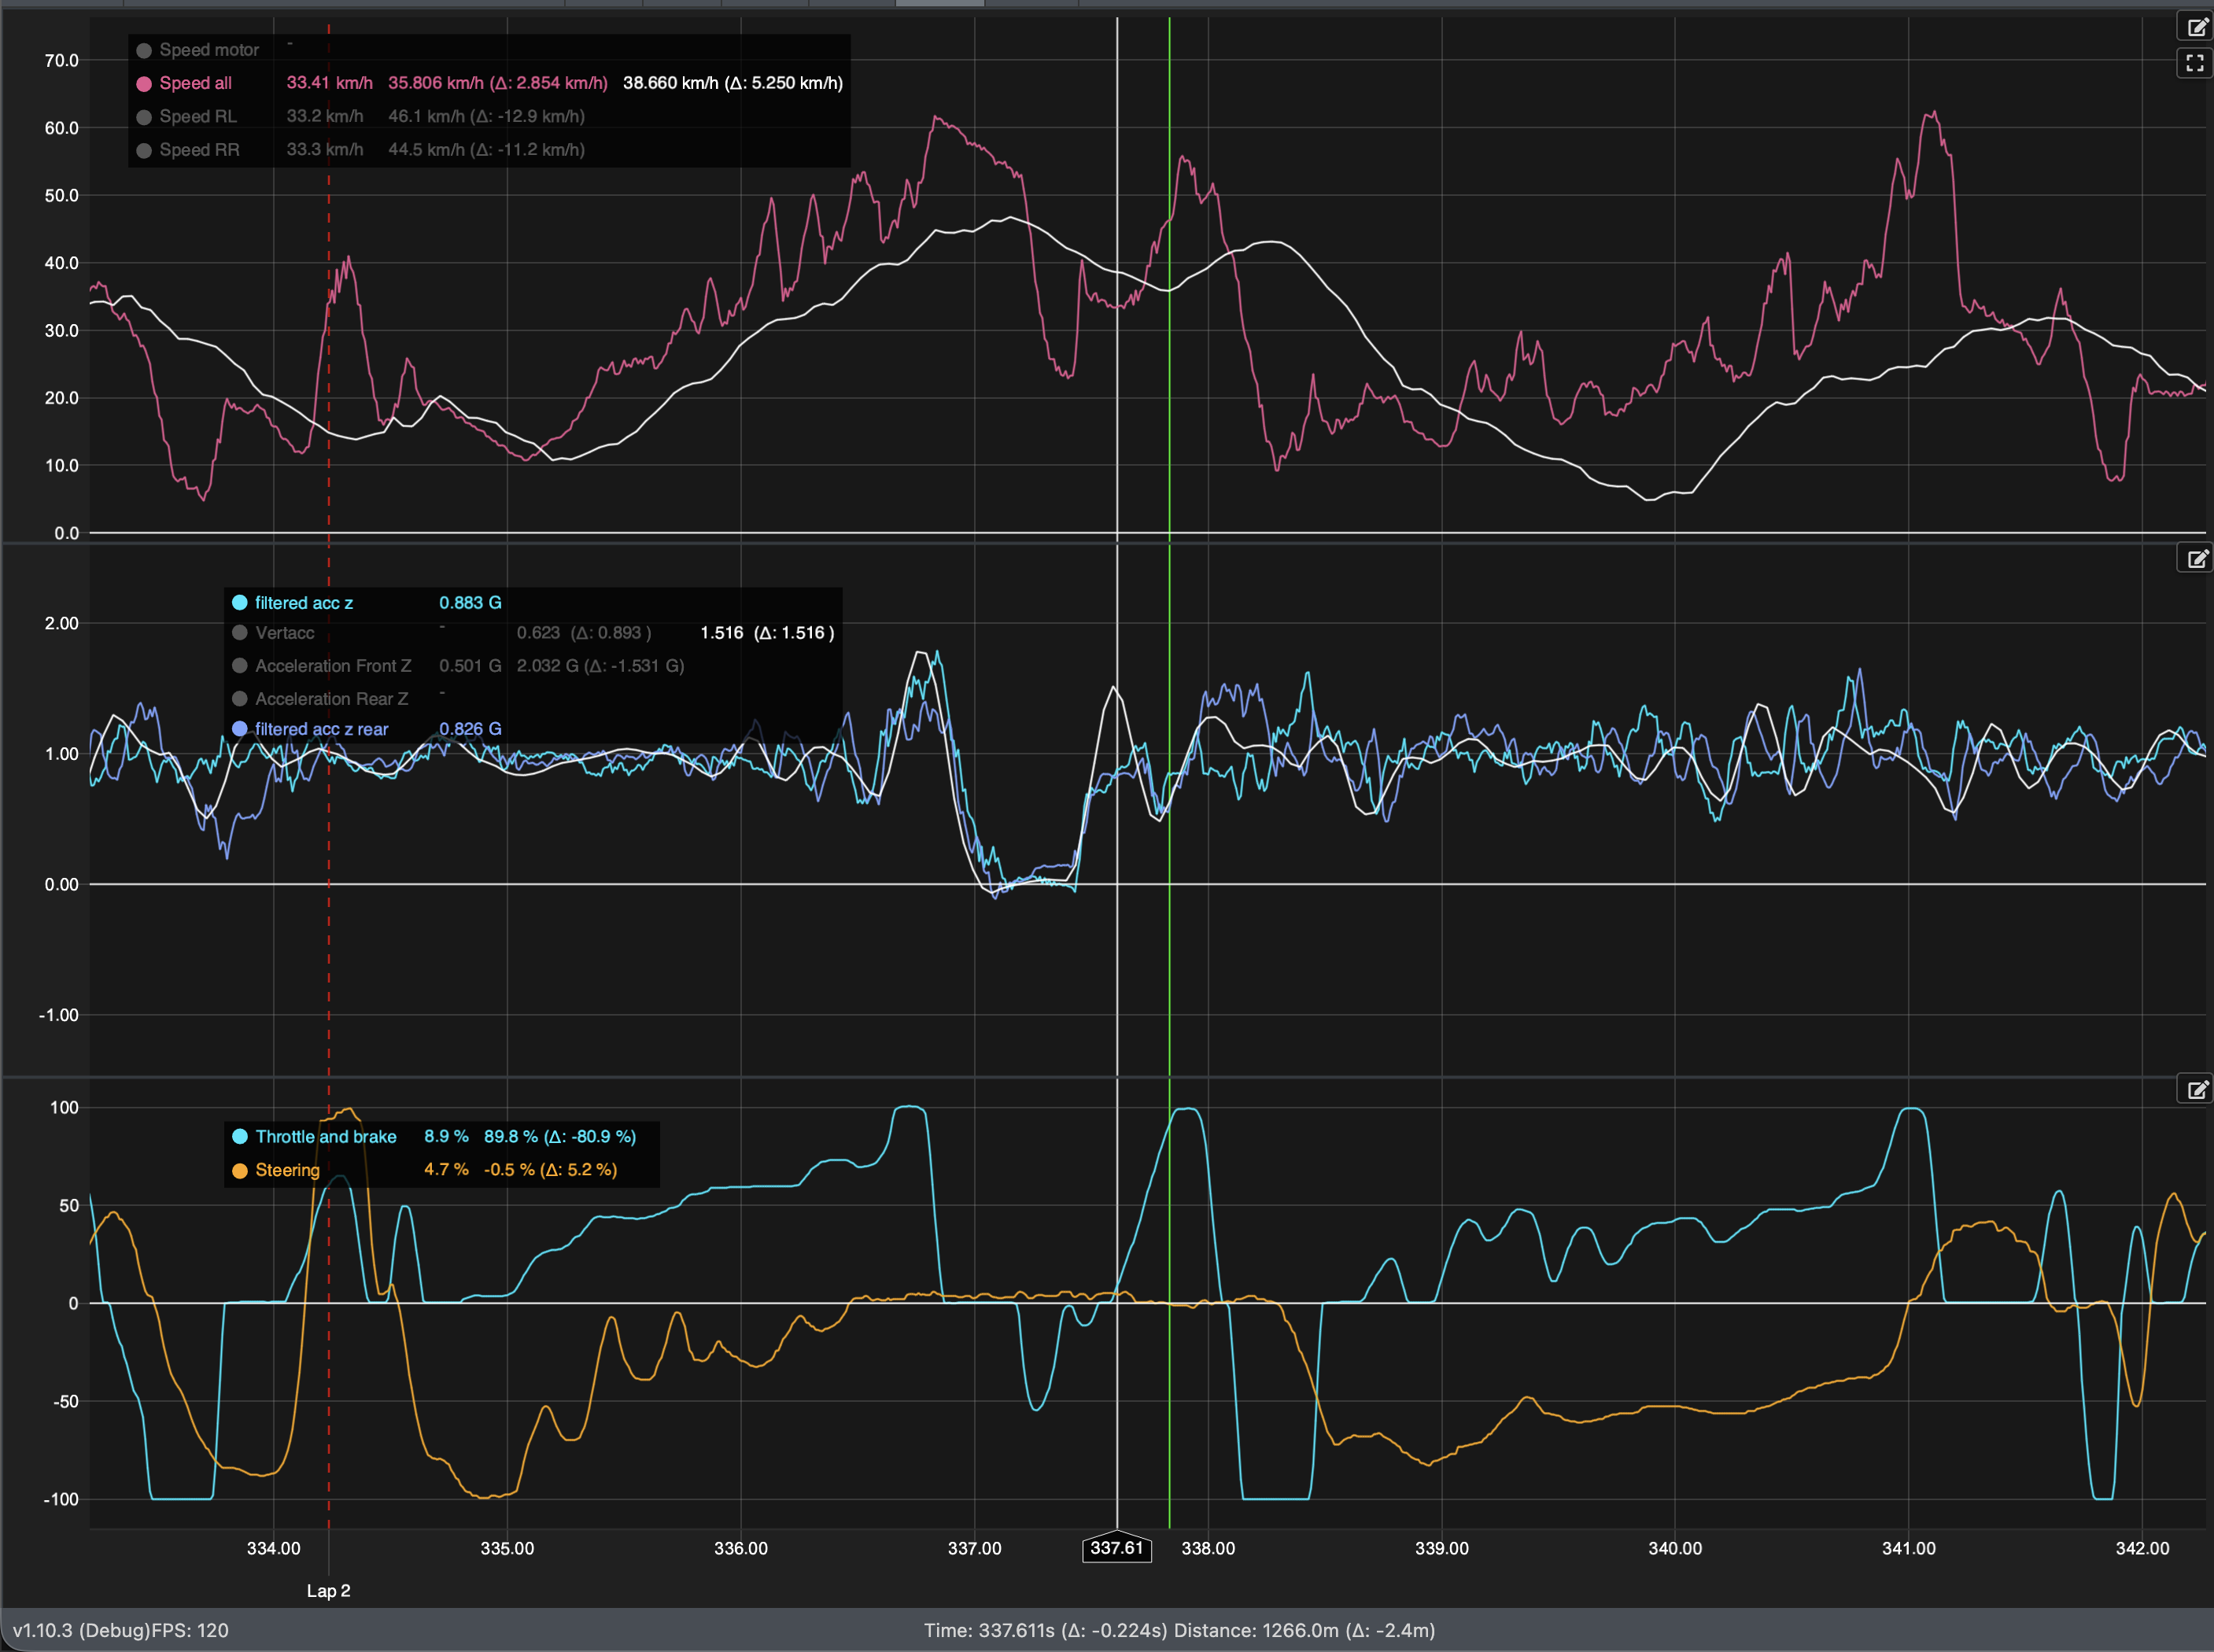
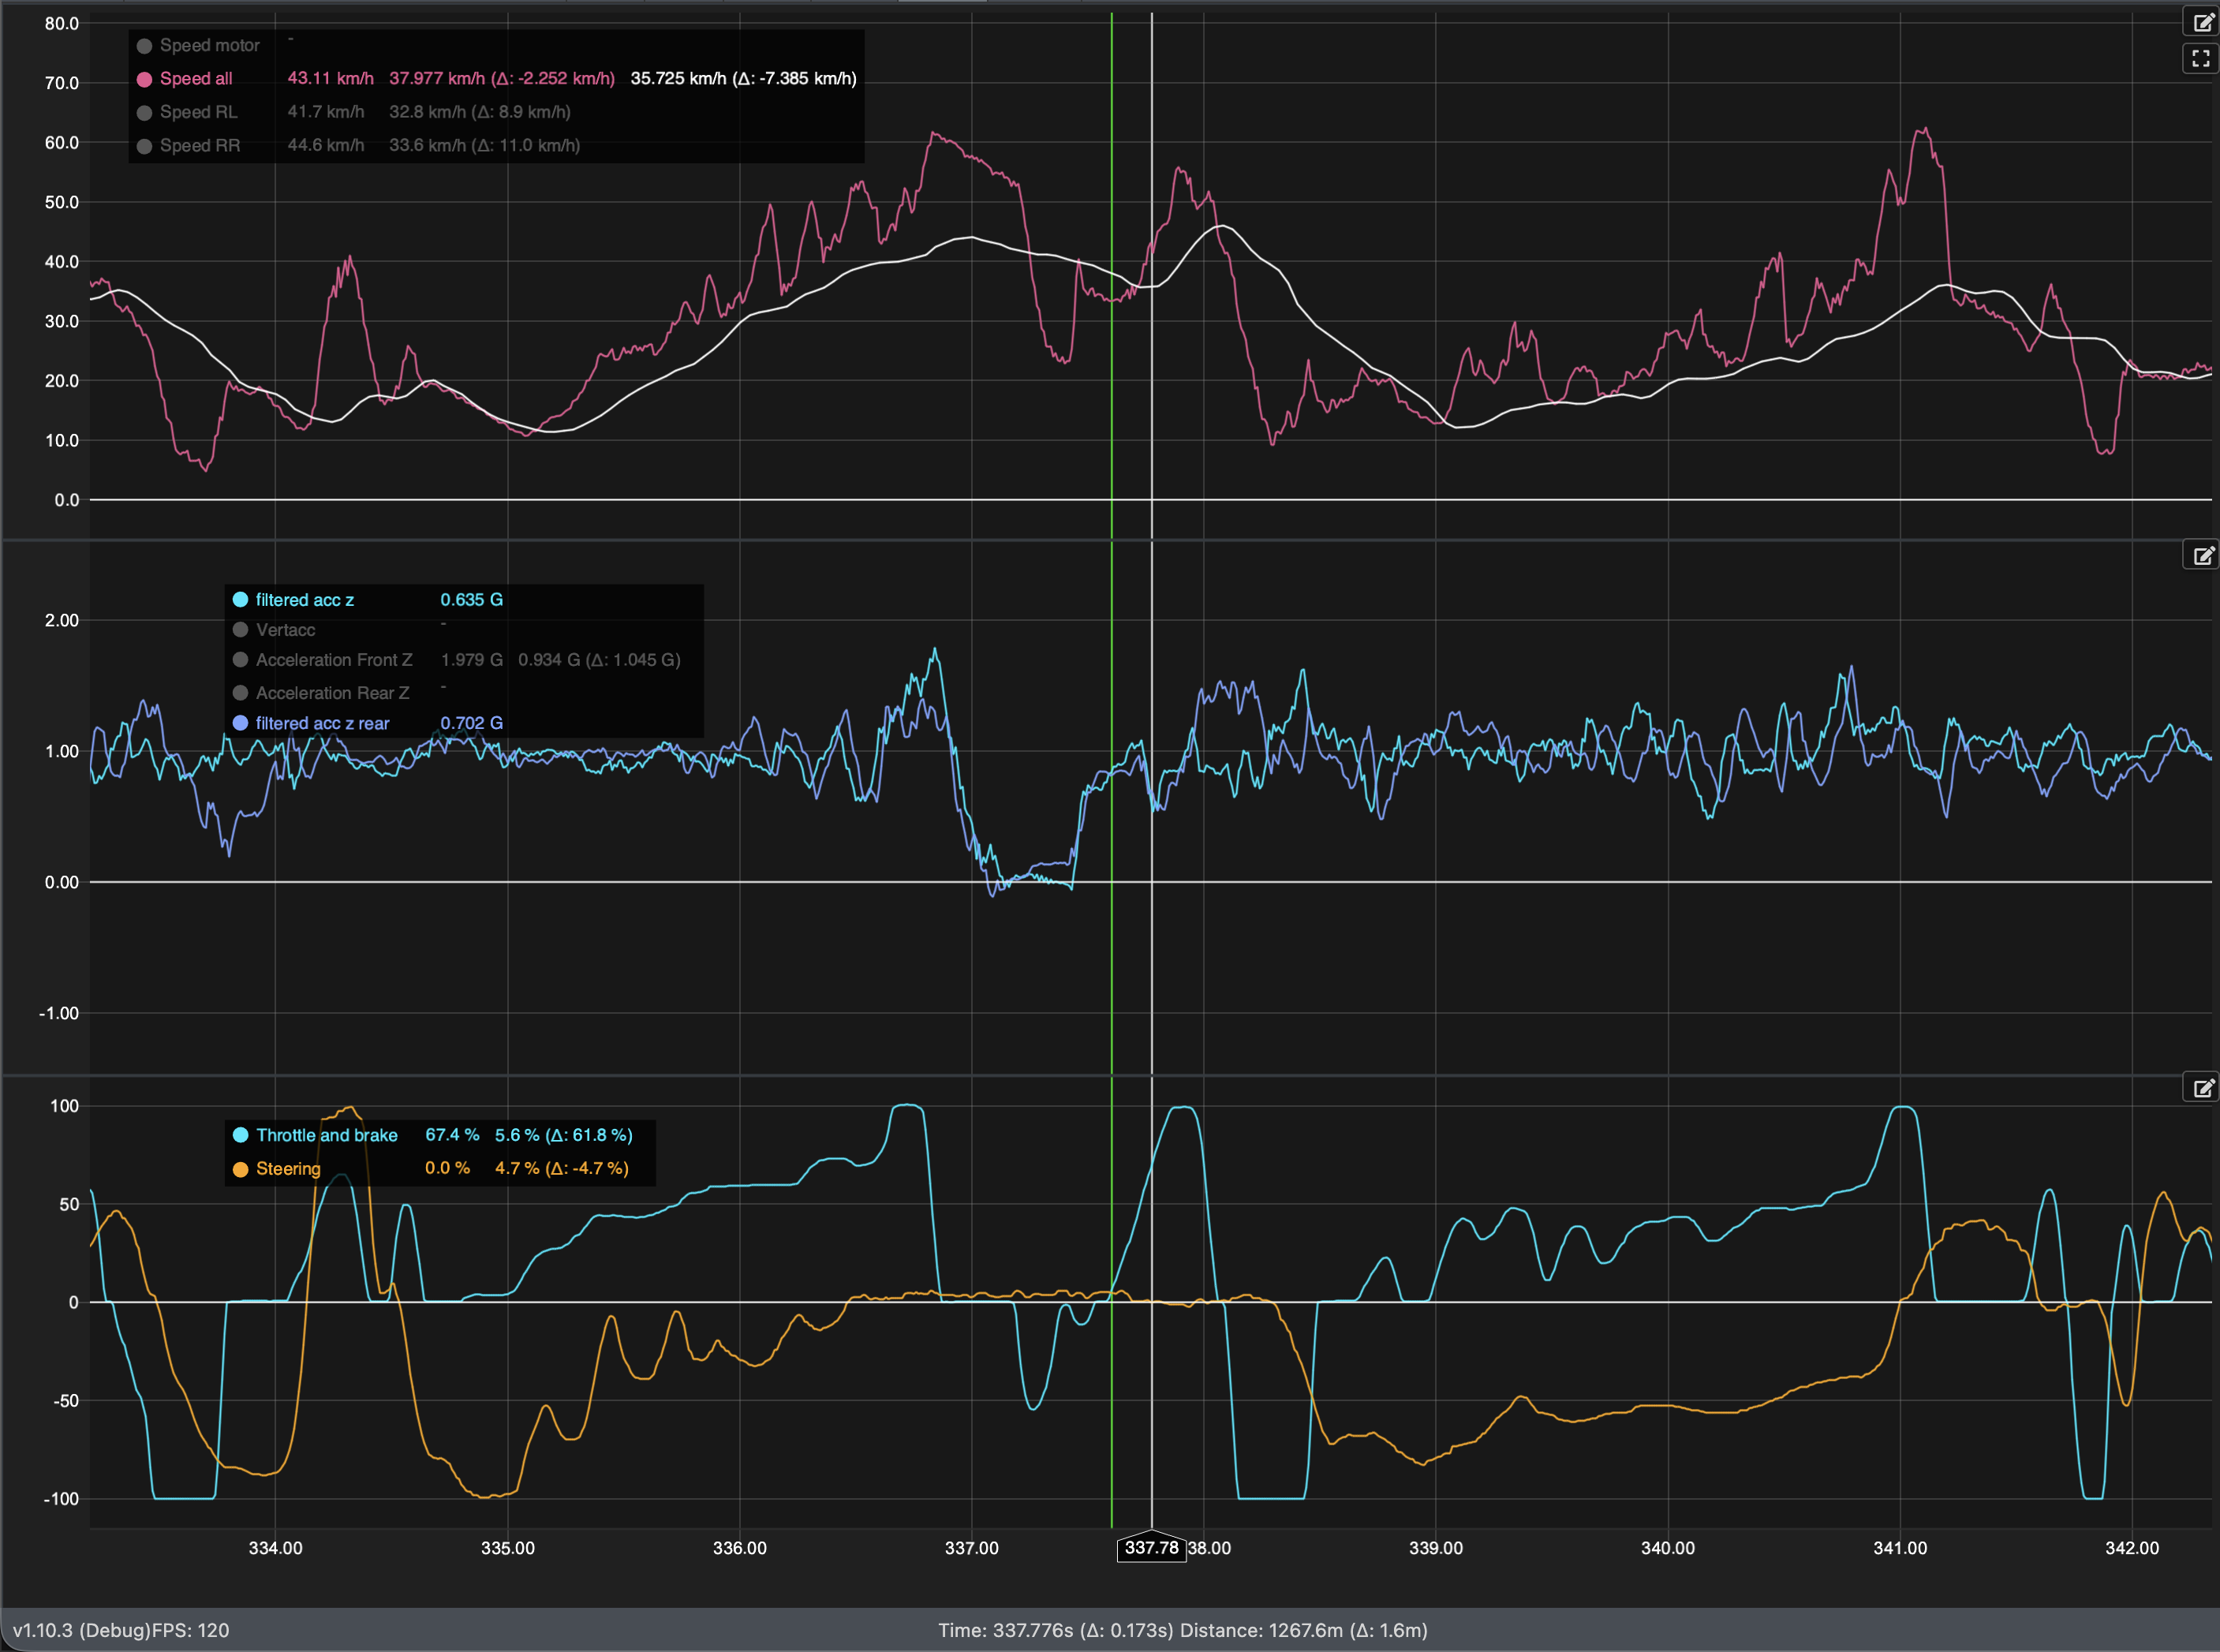
Comparing the speed traces of Dragy and RaceBox reveals that most of the time speed traces are close to each other, but in a couple of cases there are very big differences which look to be wrong readings in RaceBox. On average the differences are quite small and the biggest variation is during higher speed transitions (in most cases the heading changes as well).
Sometimes there is a 12 km/h delta between GNSS receivers when comparing the lowest speed in the corner where Dragy matches Collector quite well. These are quite critical differences which can mislead the user in case there is no alternative source for the speed.
I manually aligned the speed traces so this doesn’t evaluate the absolute lag, but focuses more on speed values and indicates the variance in lag. The lag seems to vary almost corner by corner, so the lag is a real problem and can’t be fixed with a simple time shift. Again, more research would be required.
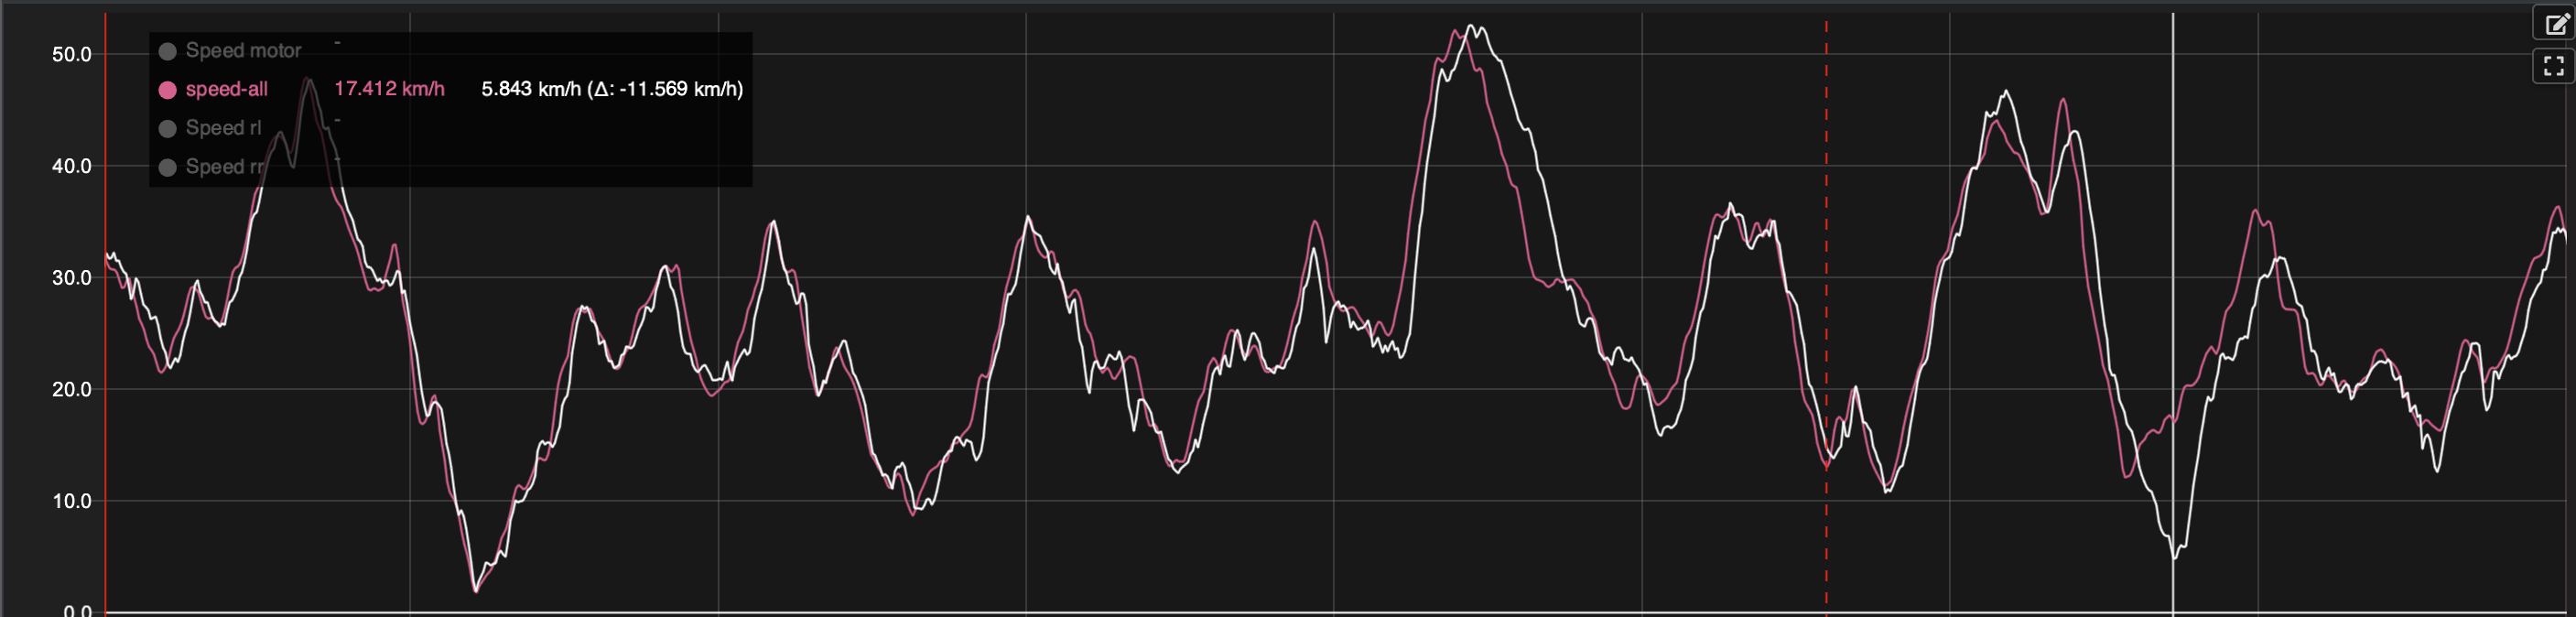
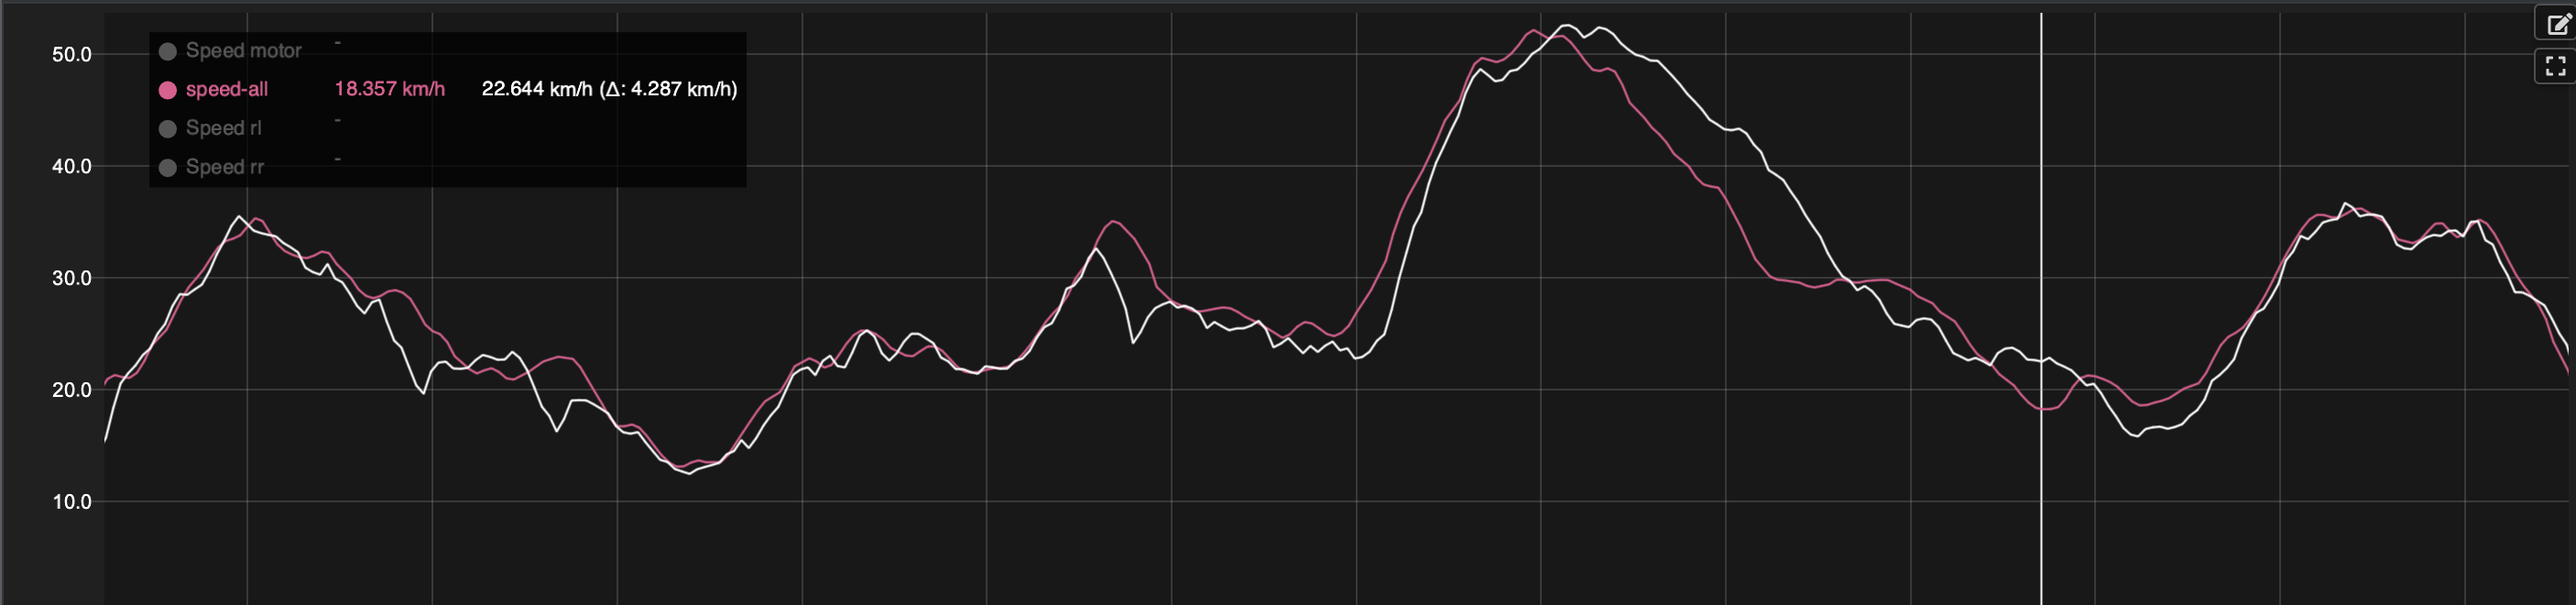
When you zoom in, there are a lot more differences. Below you can see a couple of drops on both RaceBox and Dragy in the middle of the picture. These drops are 7 km/h which is massive. This reduces trust in GNSS data, as there are random changes which you can’t verify.
A final note on the GNSS comparison is that the RaceBox data file was missing 18 data samples distributed across the file, which adds up to 0.72 seconds of lost data. This was corrected in all of the comparisons and Analyzer can now handle the missing samples.
Conclusions
GNSS sensors are a good entry point to data logging with super easy setup and installation, but very quickly the limits are reached when starting to do more serious data analytics as the driver input is missing and more importantly the data accuracy is dependent on GNSS measurement quality which has a tendency to vary.
Measuring the speed from outdrives can be tricky on loose off-road tracks as the wheel spin can be massive. This can make it quite slow and frustrating to analyze, for example, the drive ratio impact.
After the comparison, I would personally like to have both as more data gives you more confidence in your analytics. Unfortunately Collector doesn’t have GNSS support at the moment, so my vote goes to wheel speed measurement. The simple reason is that GNSS measurement quality (signal, receiver, conditions) is so crucial from my point of view. Even with high-quality measurement, you still have lag and some random places where the data doesn’t make sense. The wheel spin and jumps are easier to control. Also the wheel spin can work to your advantage as you can see what happens during braking. For example, you see if the wheels lock during braking. Wheel speed measurement also enables many other things like monitoring differential behavior or analyzing the slipper clutch.
One big element impacting the decision is the fact that GNSS doesn’t work indoors.
As stated in the first chapter, there isn’t a perfect measurement solution, but it’s more about understanding what you are analyzing and then deciding on the best available equipment for measuring it. And this is one cool part of data analytics as you accidentally learn a bit more about physics and about the car. I hope the article got you more interested in data and that it can help you to decide on what approach feels right for you.