Get started
If you are new to Testlogger, then Check out the TestLogger concept and tool overview before starting!
Install Analyzer and if you don't have an account to TestLogger, please create one. Check this page for getting started Getting started.
Downloads
- Windows: https://github.com/testlogger/tl-analyzer-releases/releases/latest/download/TestLogger-Analyzer.exe
- MacOS: https://github.com/testlogger/tl-analyzer-releases/releases/latest/download/TestLogger-Analyzer.dmg
After installation and opening the application for the first, you must login. Use your TestLogger account for login.
Familiriaze yourself with the UI
We recommend to check the Navigation and shortcuts page to understand what UI elements there are and what shortcuts the application provides.
Open data file
First thing to do is to open any data file. Click ![]() or use shortcut Cmd/Ctrl + o to open the data open dialogue. See more details from Opening data page.
or use shortcut Cmd/Ctrl + o to open the data open dialogue. See more details from Opening data page.
Settings
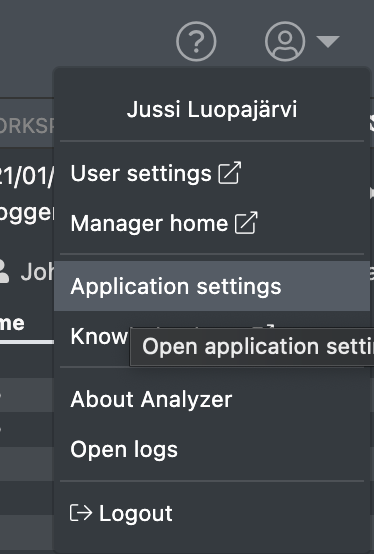
It's good to check application settings after you have opened your first data file. You have one critical setting to be defined which is related to the distance calculation.
Application settings is available under the user menu on top right corner

| Attribute | Default value | Description |
|---|---|---|
| Calculated distance channel | Speed motor | The speed channel what is used to calculate the distance. Speed or distance channel. |
| Display mode | Dark mode | Possibility to switch between dark and light interface. In normal situation Dark mode is better, but in bright sunlight we recommend to try light mode. |
| Default file browser tab | Local files | Define your desired default file browser tab. |
| Display FPS | Disabled | In case you are having issues with Analyzer performance, turning the FPS display on gives you more details in which scenarios the application performance drops. |
| Cursor follow | Enabled | Toggle cursor mode between auto follow and manual click cursor. Disable in case you are having performance issues with cursor movement. |
| Cursor markers | Enabled | Toggle small + markers shown on graphs in cursors position. Disable in case you are having performance issues with cursor movement. |
| Debug mode | Disabled | Enable various debug features for troubleshooting purposes. |
What's next?
Read more about the workspace and analytics tools to start analyzing data by opening a data file from your local files or download file from TestLogger Manager.