Workspace
Workspace is designed to be very flexible to fit your needs. Main features are as follows.
- Multiple chart types (e.g. line chart, 2D scatter, 3D scatter, density)
- Adjustable chart element sizes
- 12 column grid for adjusting the chart sizes
- Viewing and editing separated to own modes
- Tabs for splitting chart elements to multiple pages
- One page has no limit in height, so it's possible to expand the page in vertical direction over the screen size
Workspace view and edit mode
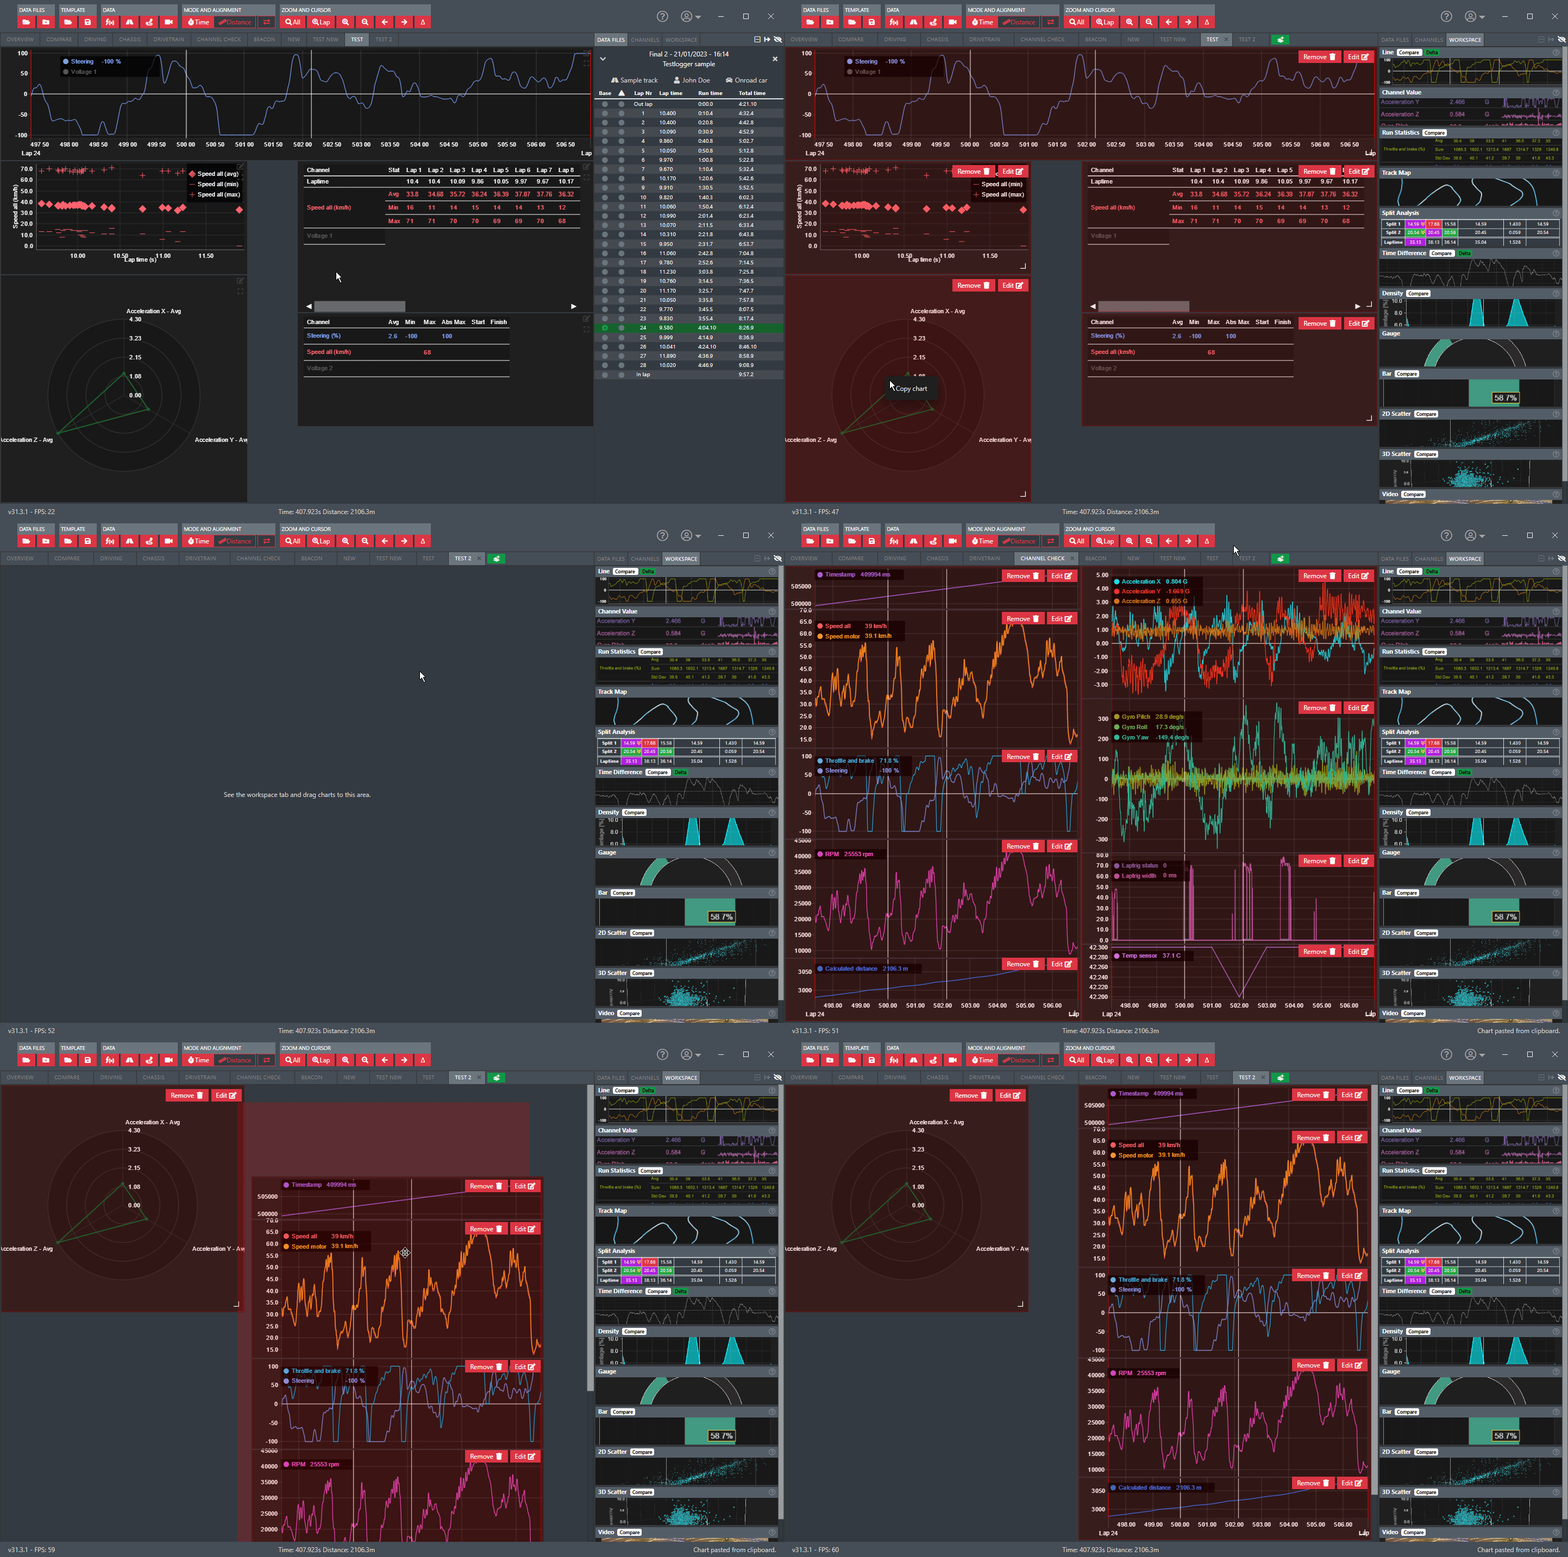
TestLogger Analyzer has separated view and edit modes for the workspace. View mode is naturally used for analysing the data and edit mode to modify the workspace. This is done to give full focus on data when viewing and optimising the screen usage.
Change to edit mode is done from side bar by changing the tab to Workspace or using the keyboard shortcut e.

Tabs
Remember to switch to workspace edit mode to modify tabs.
Possible actions
| Action | Instructions |
|---|---|
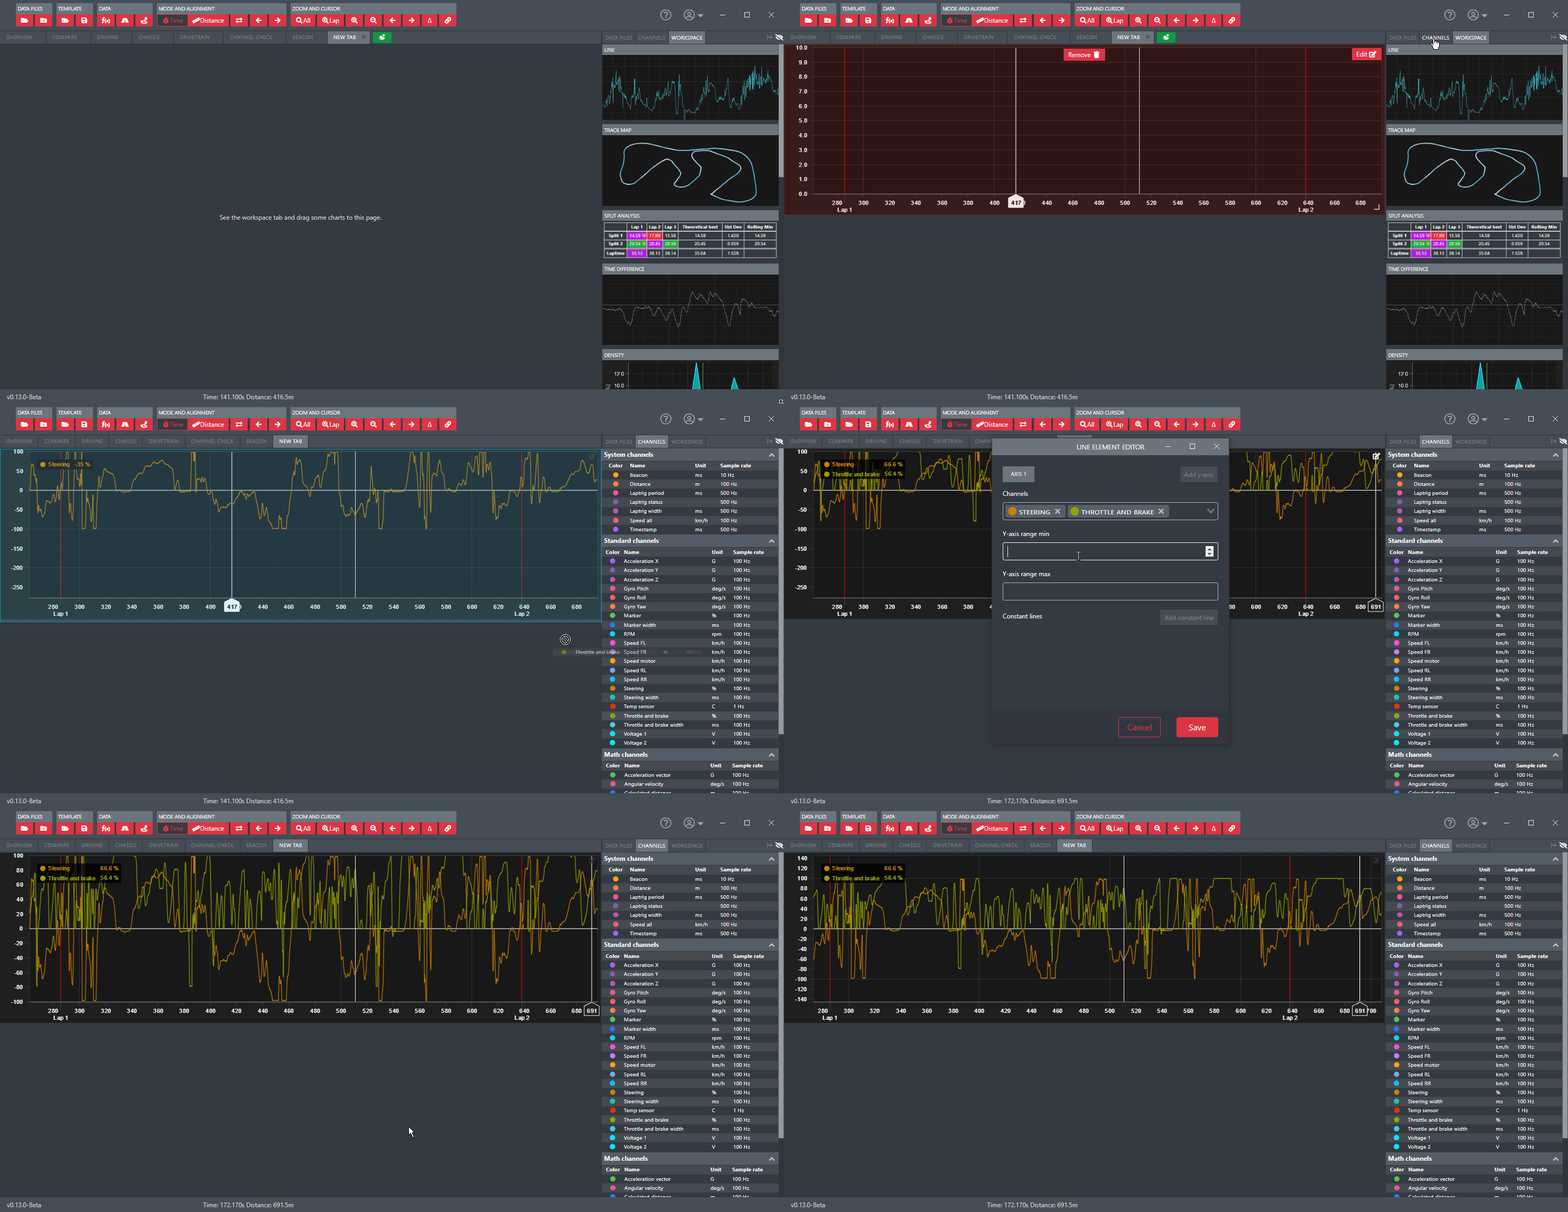
| Add tab | Click green button after last tab. Give name and click save (check mark) |
| Rename tab | Double click tab name. After edit, click save (check mark) |
| Move tab | Drag and drop the tab to new position |
| Remove tab | Click X beside the tab name |
Data area
Data area is the place to insert your required elements for data analysing. Chart area is 12x12 grid, but it can be expanded vertically.
Data elements
See Data Elements page for details.
Chart editing
| Action | Instructions |
|---|---|
| Add element | Drag and drop to the chart area or quick add to chart area with double clicking the chart element. |
| Move element | Move by dragging them in edit mode. |
| Resize element | Resize from the bottom right corner of the elements. |
| Remove element | In edit mode click the remove button. |
| Edit element | Click edit button |
Copy and paste charts
Right click charts in edit mode to copy it to clipboard for easy addition or sharing to others. Right click empty space in the data area to paste chart from clipboard.

Element channels
Add data channels to chart elements by drag and dropping channels from the channel listing or select them from the channel dropdown from charts edit modal.
Some charts allow multiple channels and some only one.

Expand charts
Every chart can be viewed in full screen ![]() by clicking the expand button.
by clicking the expand button.
Editing charts in full screen is not supported.