Analyzer Free contains powerful fixed template for working with TestLogger Collector data files.
Main features of the workspace are as follows:
- Multiple data elements (line, 2D scatter, track map, split analysis)
- Multiple predefined workspace tabs
- Run content
- Toolbar
- Channel listing
(As of 1/2024) Firefox browser suffers from lower application performance compared to others due to charting limitations.
Below image shows main workspace with key features: toolbar, tab selection, sidebar and data area highlighted.
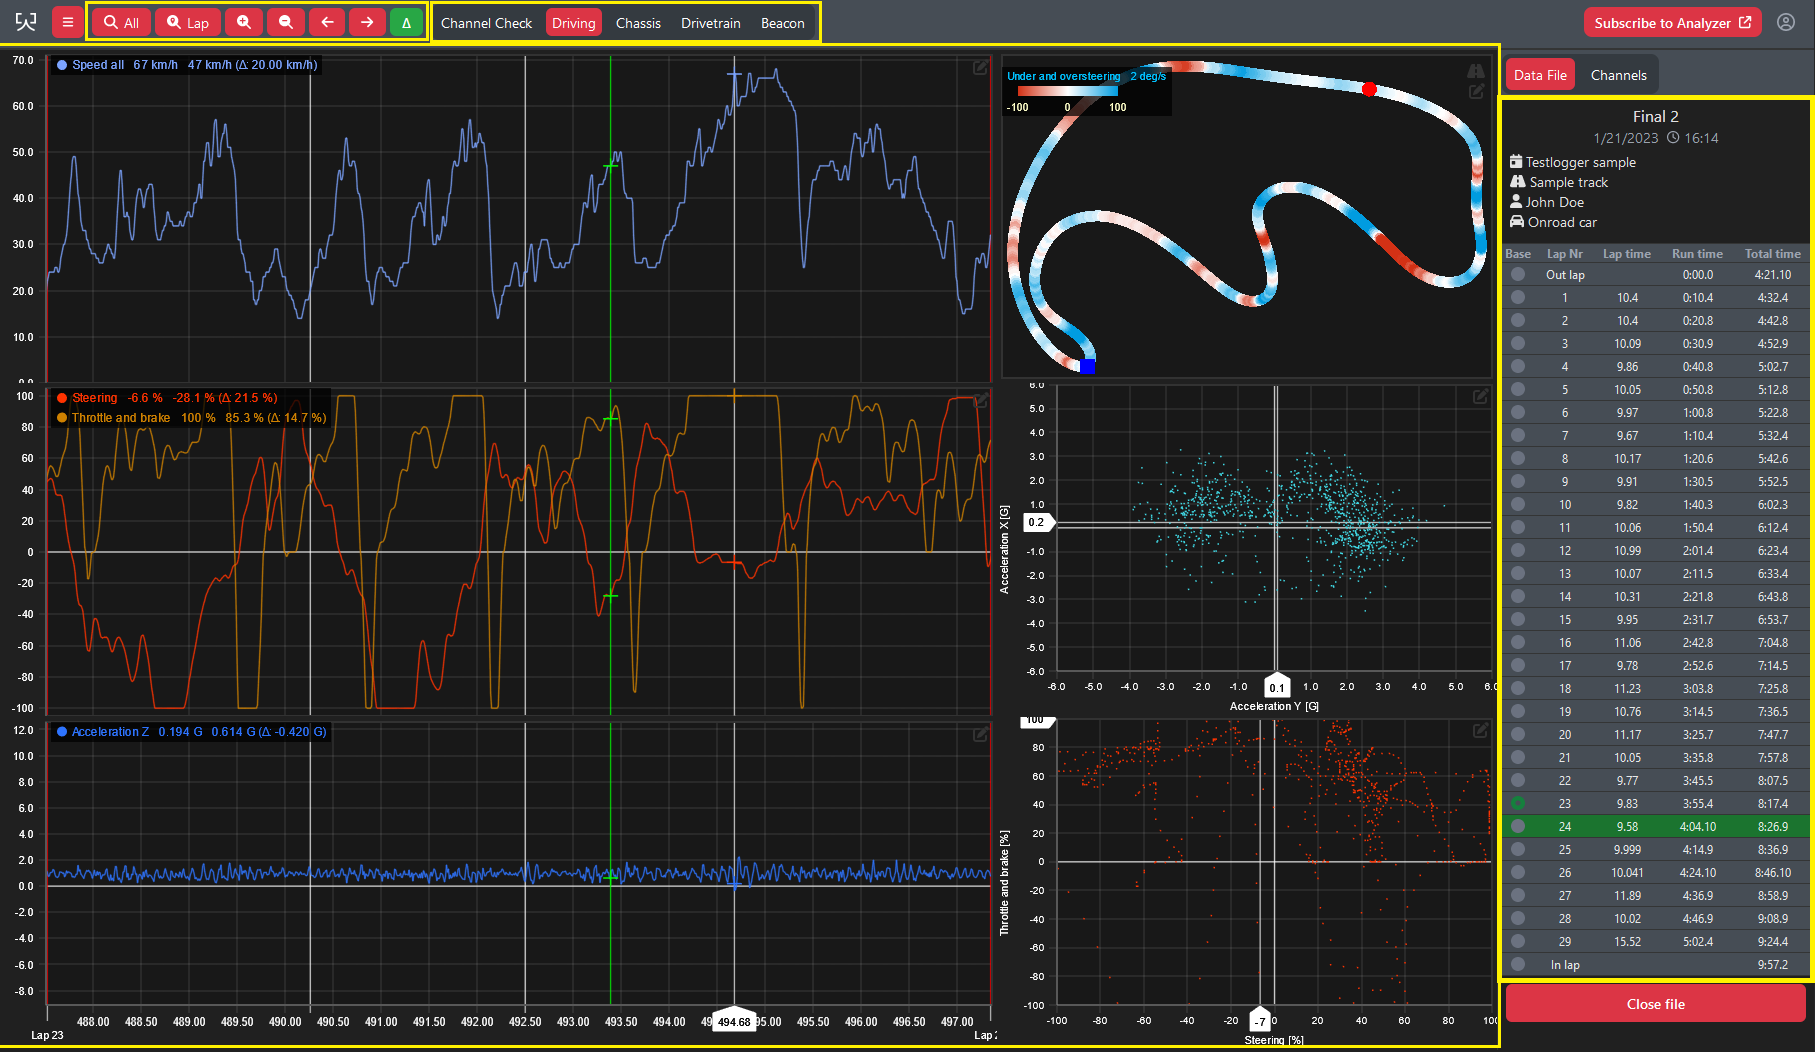
Data elements
See Data Elements page for details.
Run content
Data file sidebar tab shows opened runs lap information and its relevant details.
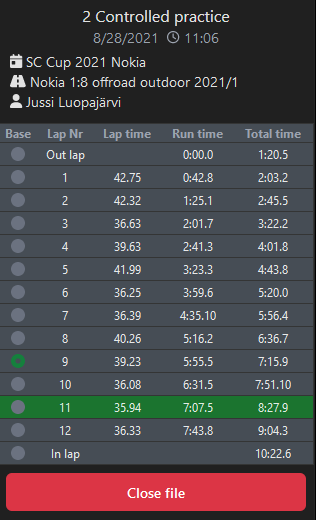
Each row has base selection radio button, lap number, lap time, run time and total running time. Header shows files name, date, time and session. Also track, car and driver is shown if present in the files metadata.
Fastest lap is highlighted.
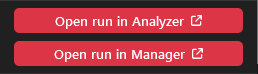
Run content also displays open buttons to open run in our other tools when data file is opened from TestLogger Manager. Read more at Opening data.
Channel listing
Channel listing tab shows all base files data channels categorized based on channels type.
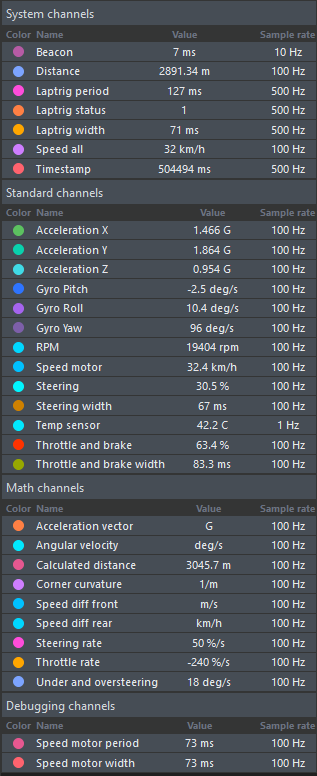
Each row has channels colour, name, cursors channel value with unit and channels sampling rate.
Channel categories
| System channels | Important system channels to keep the system working |
| Standard channels | All other logged channels |
| Math channels | System and user defined math channels. |
| Debugging channels | Channels used for system debugging (hidden by default). |
See Math channels page for details about calculated math channels.