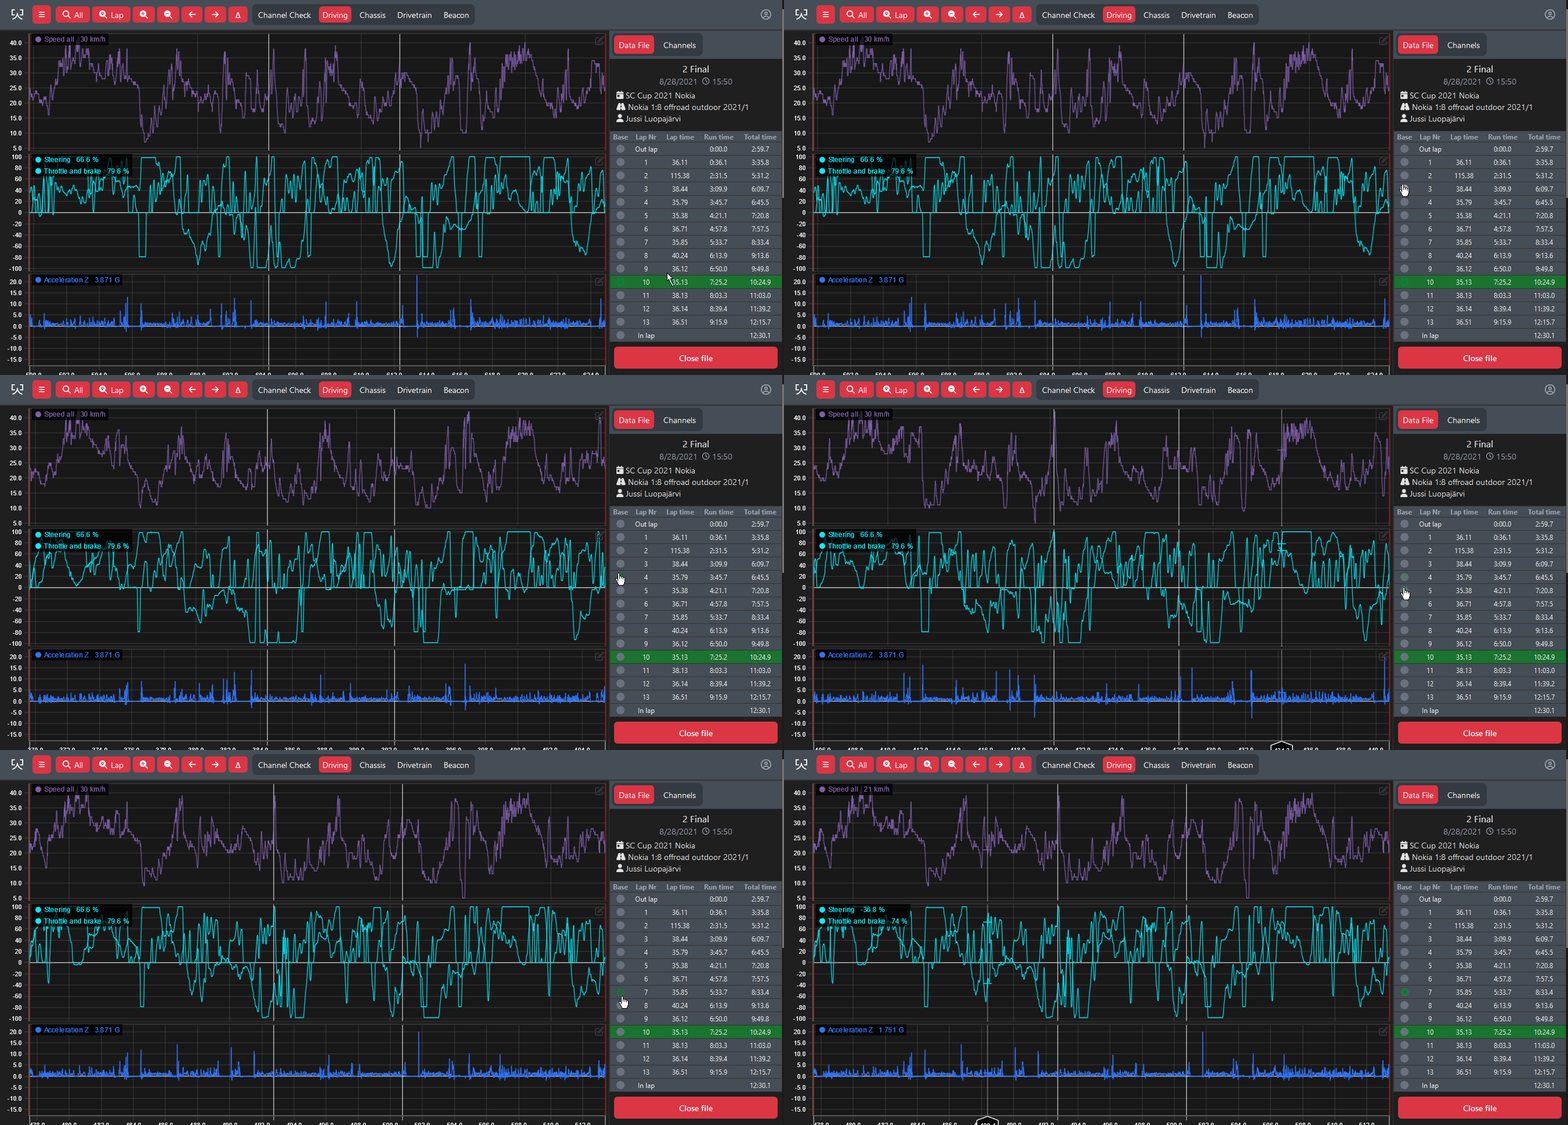
Below are explained the core analytic features needed to browser your data.

- Zoom out to show whole data file
- Zoom to currently active lap
- Zoom in
- Zoom out
- Pan data to left
- Pad data to right
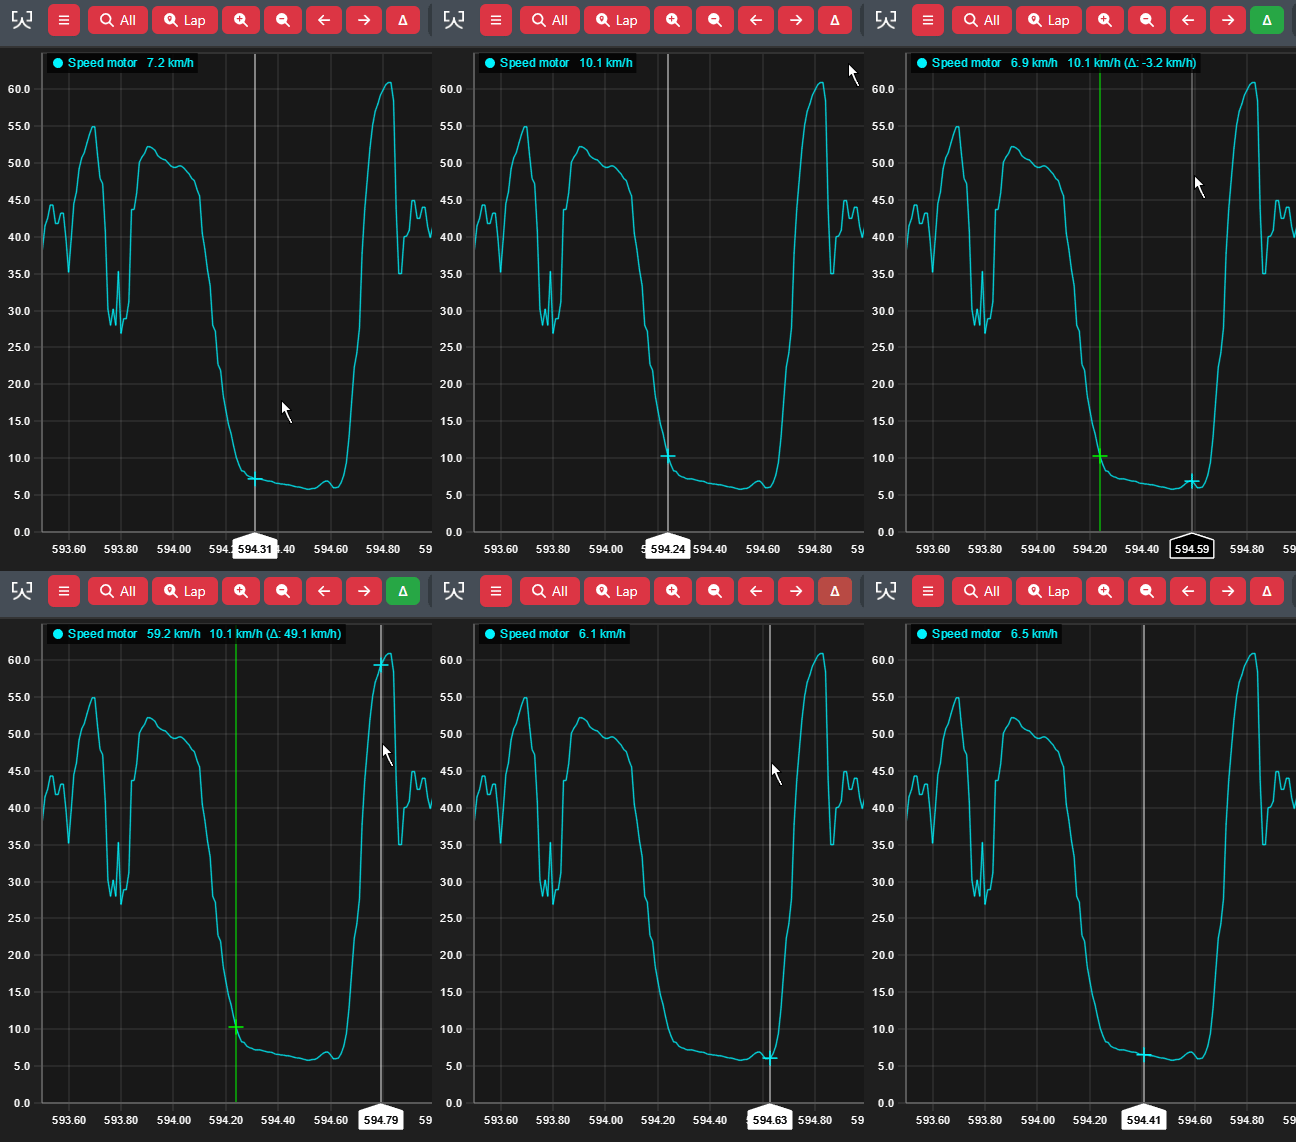
- Toggle Delta marker to cursors position
Keyboard shortcuts
| Up Arrow | Zoom in data range |
| Down Arrow | Zoom out data range |
| Left Arrow | Pan data left |
| Right Arrow | Pan data right |
| Space | Set Delta marker |
| A | Zoom to whole file range |
| S | Zoom to cursors lap range |
| Shift Scroll | Zoom in and out |
| Ctrl/Cmd scroll | Pan data left and right |
Lap selection
Analysed base lap is selected by clicking the run contents radio buttons. Base lap updates track maps data points, sets zoom range to selected lap and updates data in all data elements.

Cursor
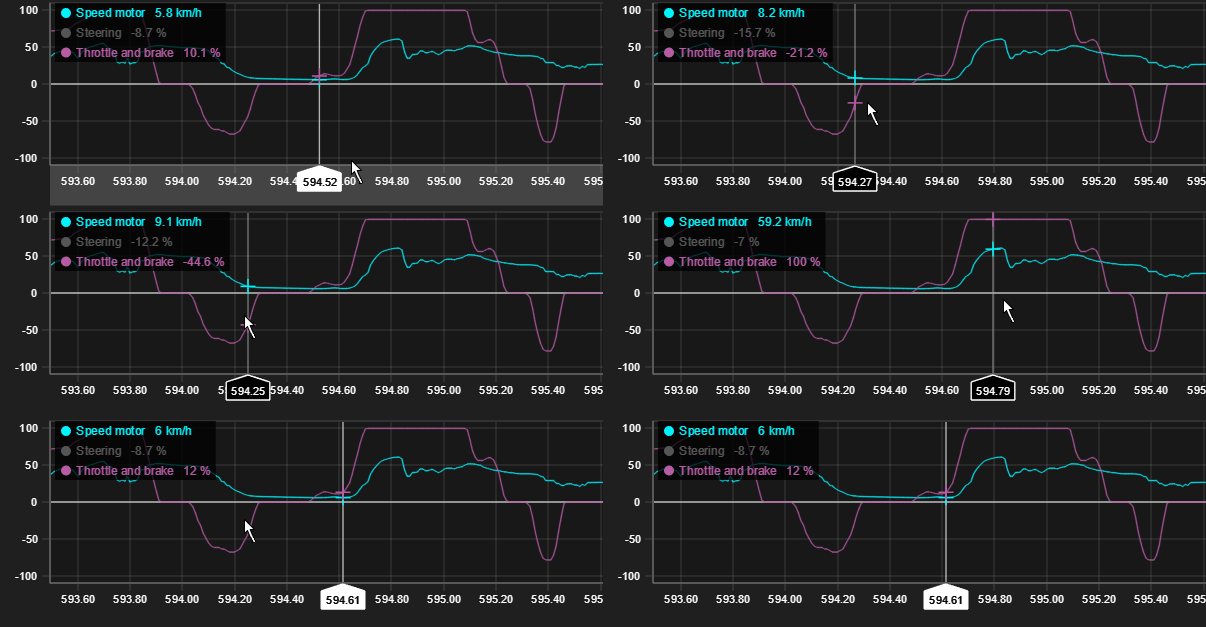
Data cursor is the main way of viewing data.
- By default cursor follow the mouse and corresponding data values from the cursors position is updated in data element legends and in channel listing values.
- Cursor can be fixed to certain position by clicking the left mouse button.
- Cursors position can be moved and adjusted by dragging with mouse pressed

Delta marker
Delta marker allows for comparing selected positions value to cursors value.
Marker is set with toolbar button or alternatively with space hotkey.
Line legends display the cursors value and its difference to the cursors value.

Zoom
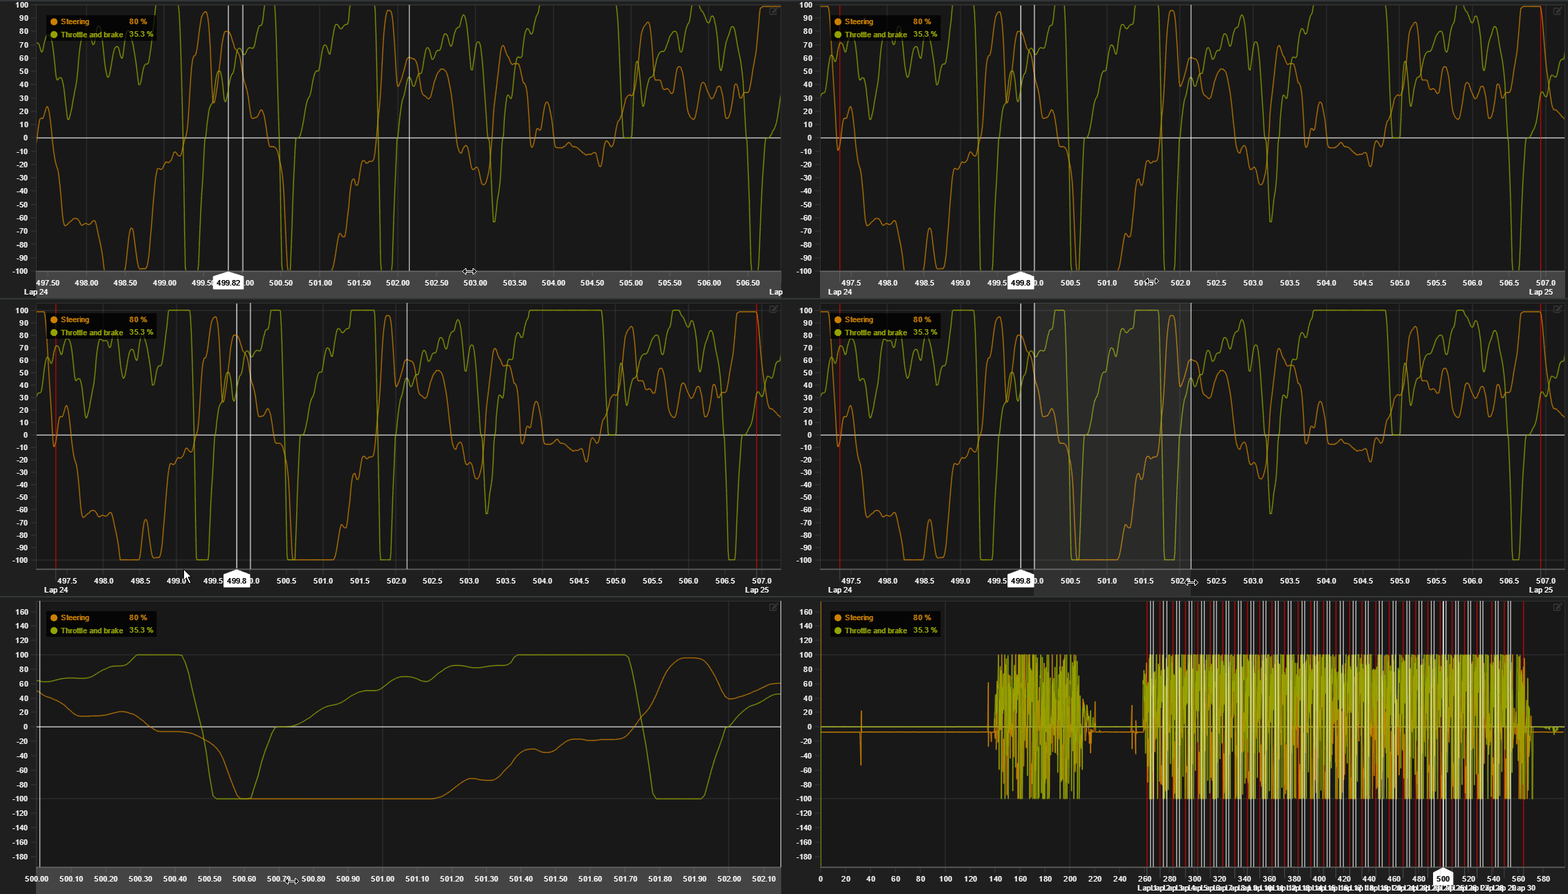
Data range can be navigated multiple ways in Line charts.
- Use arrow keys or toolbar buttons to zoom
- Zooming can be done from both x-axis and y-axis of chart element by dragging the area you want to zoom
- Double click axis and whole range will be shown
- Mouse wheel can be used to zoom in and zoom out. Mouse cursor needs to be on top of zoomed axis.
- Drag axis with secondary mouse button.
